
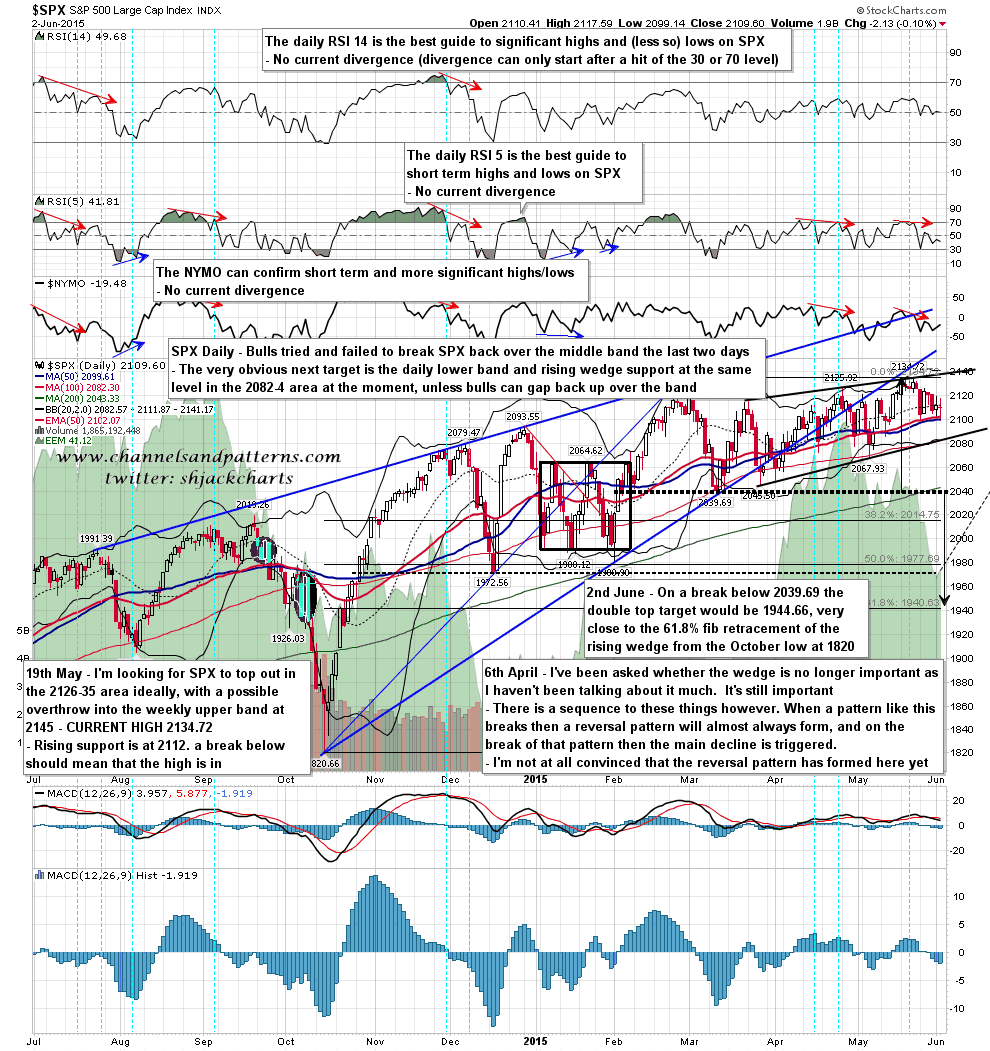
SPX spent another day yesterday with a low at the SPX 50 day MA and EMA in the 2100 area, a rejected high at the 50 hour MA, and close just under the daily middle band. I had thought that SPX might resolve this by gapping up over the middle band but there was no breakaway gap today and the opening gap was filled in very short order.
2100 area support is in the …. um …. 2100 area today, the daily middle band closed yesterday at 2112, and the 50 hour MA closed yesterday at 2115.3. In the absence of a break up the obvious target is still in the 2082-4 area, if bears can ever manage to finish beating 2100 support to death. SPX daily charts:
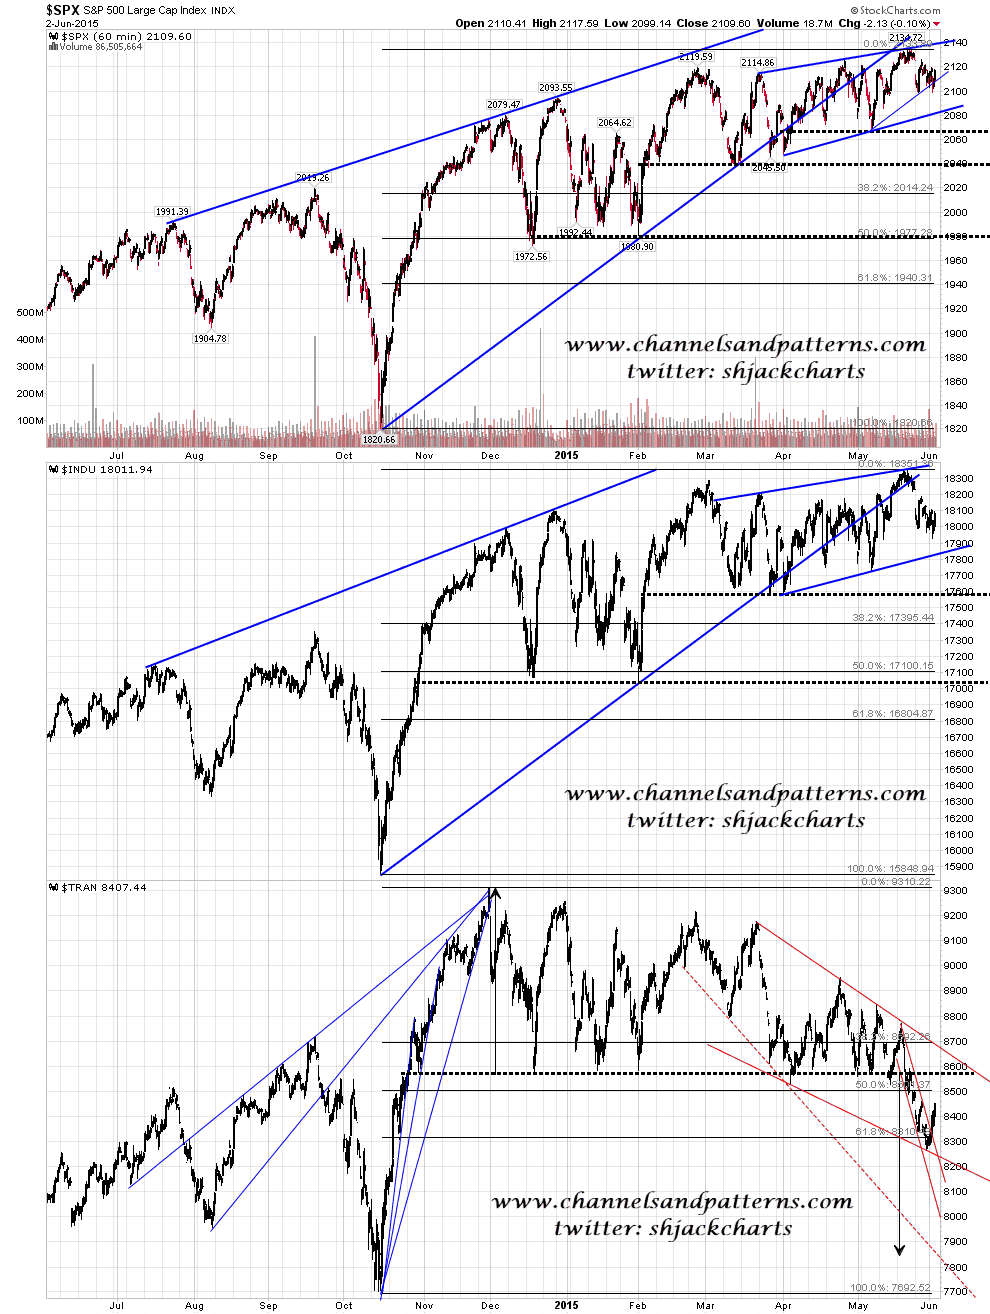
What do the other indices suggest? SPX & Dow are clearly looking for a move lower to test wedge support trendlines, and TRAN is clearly in a downtrend, though it may be forming a small IHS, and in the event of a rally a retest of broken double top support in the 8580 area would a very obvious target. Scan 3x 60min SPX INDU TRAN chart:
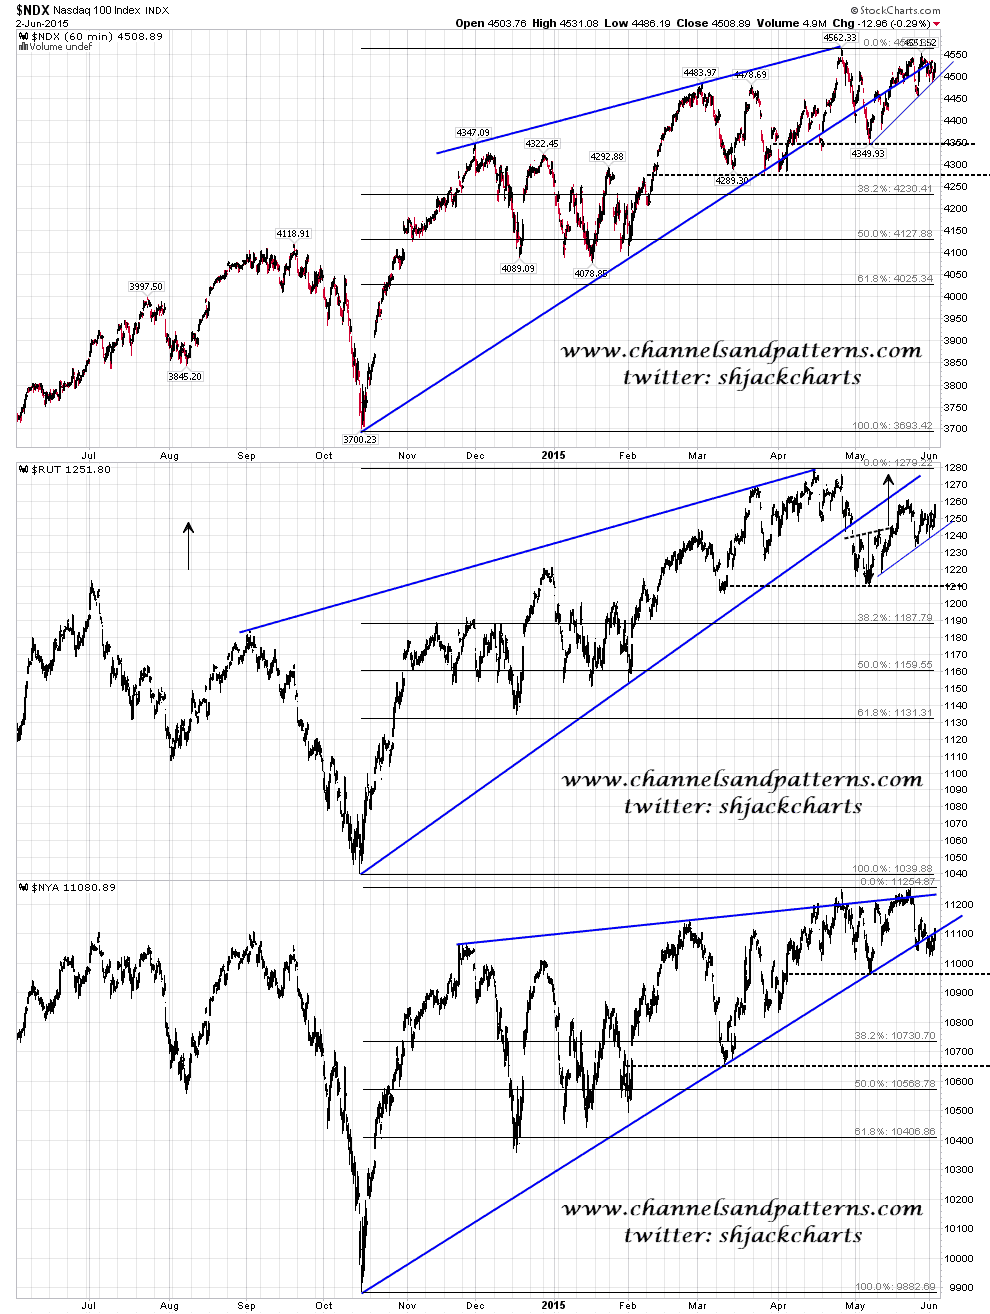
All the rising wedges from the October low have broken down, but not all patterns from the start of May have broken down yet. There are still unbroken support trendlines from there on both RUT and NDX, and an IHS that has not yet made target on RUT. There is some support for a retest of the highs on these charts, though only to make the second high on double tops. Scan 3x 60min NDX RUT NYA chart:
SPX is breaking back up over resistance here, and testing yesterday’s high. If bulls can sustain trade over the 50 hour MA this morning then I’ll be looking for a retest of the highs, and failure there.
