Well, that was yet another ridiculous trading day for the books. We started off deeply in the red, rallied mightily for no logical reason, hung out in a tight range for most of the day, and then finally wound up modestly down. Sheesh. This is getting old. Where are the crashes of yesteryear? In any event, the Ichthus pattern is still the one to watch, with a failure of the horizontal a harbinger of good times to come – – – if it would just actually happen.
Slope of Hope Blog Posts
Slope initially began as a blog, so this is where most of the website’s content resides. Here we have tens of thousands of posts dating back over a decade. These are listed in reverse chronological order. Click on any category icon below to see posts tagged with that particular subject, or click on a word in the category cloud on the right side of the screen for more specific choices.
Half the Sky
I took this photo this morning, which shows the left half of my trading desk. It’s very typical since (a) George Carlin is playing on one screen and (b) there are charts showing the market plunging and then, out of the blue, reversing powerfully higher.

Swing Trading Watch-List: HA, CA, MAR, MRVL NCR

The Art Of Chart
I have an announcement today as I set up a new site at the weekend to cover my swing trading collaboration with fellow chartist Stan Nabozny. The site is at www.theartofchart.net, and I christened it yesterday with a post on bonds. I will be posting most of my, and our, work outside equity indices there in future.
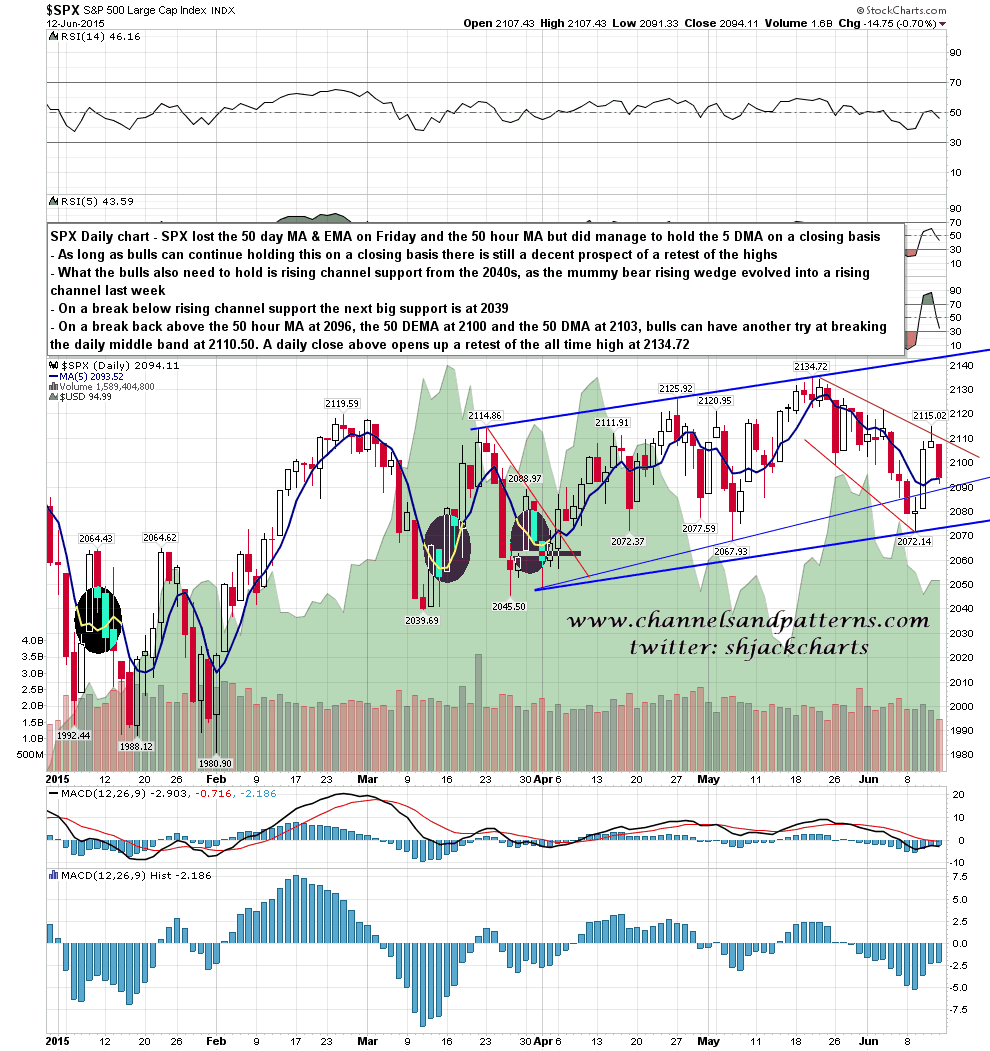
Bulls had a bad day on Friday and managed to lose support at the 50 day MA and EMA and at the 50 hour MA. They did however managed to hold on to the 5 day MA on a closing basis, and are still in with a shot at a retest of the highs at the moment, though the odds have worsened considerably. Support is at the 5 DMA at 2093.5 (closing basis) and rising wedge turned channel support in the 2073/4 area. Resistance is at the 50 hour MA at 2096, the 50 DEMA at 2100, and the 50 DMA at 2103. If bulls can break back above those (closing basis) then they can have another run at the daily middle band at 2110.50. If they can manage that then a retest of the all time high opens up. If they can’t then 2039 is the next obvious support. SPX daily chart:
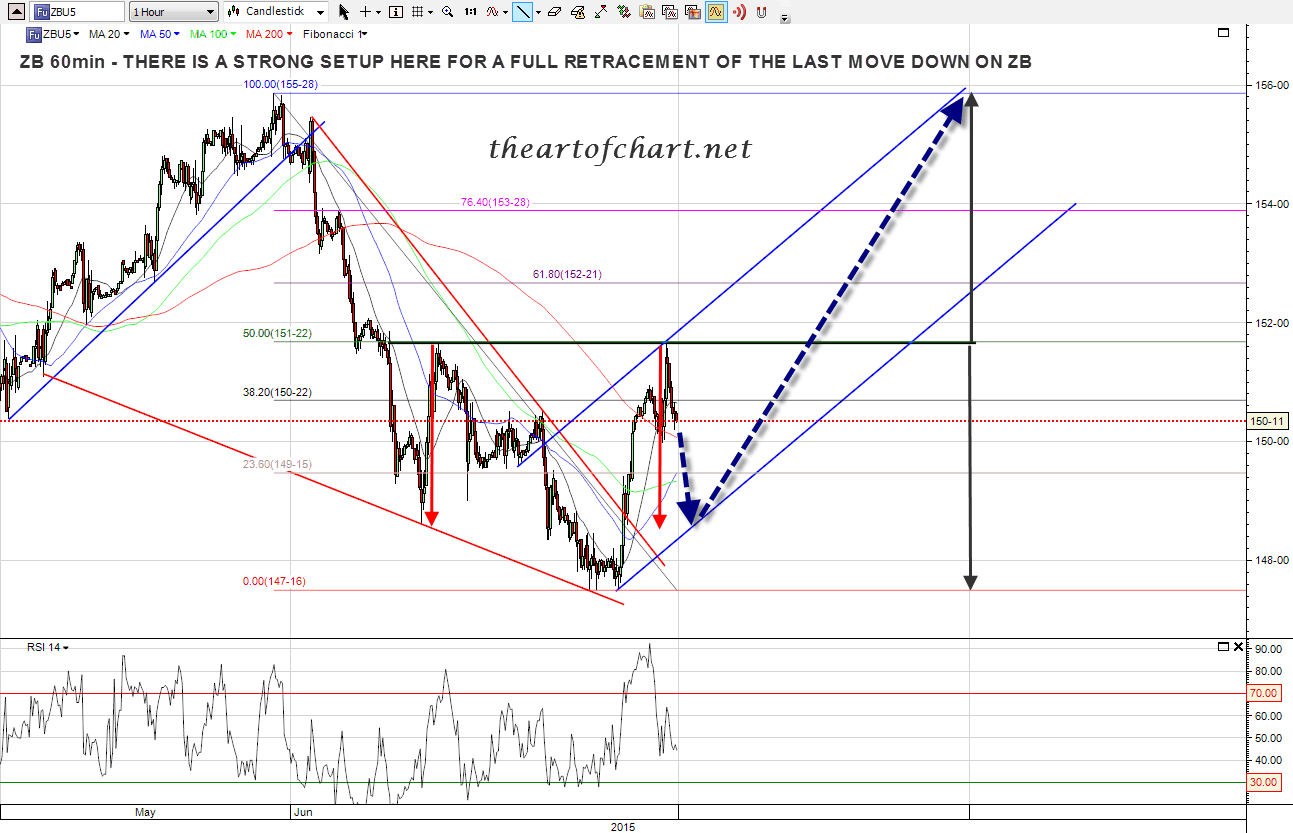
Bonds – A Summer Projection
I said on Wednesday morning that I was looking for a slightly lower low on TLT before a likely full retracement of the last move down. After that lower low and the wedge breaking up i was wondering whether an IHS might form at the obvious possible IHS neckline at the 50% fib retrace. On the ZB (30yr treasury future) below you can see that ZB reversed on Friday at that 50% fib (TLT reversed a little lower) and if this IHS continues to form then on a break over the neckline the target will be the 100% retracement of the last move down that I was looking for last Wednesday. ZB 60min chart: