Before we discuss the basic of options parameters for trading, we need to understand the concept of volatility. This is not simply an observational number, thought it can be used as such. In general stock investors want to avoid volatility. They want to minimize the standard deviation of their investments, as large drawdowns can be petrifying to some. This is a reaction that encompasses more than trader psychology; when the broker taps you on the shoulder with his margin call, it really is game over for you. This can be unfair, but those with the gold set the rules.
However volatility is much much more than an indicator of deviation of price. Inherently, volatility mean reverts. Specifically, when we look at the volatility of an instrument over a fixed length of time, say one year, the relative highs of the year, and relative lows of the year can be identified. They usually (though not always) revert back down to the mean. This is an edge that be utilized. More on this later.
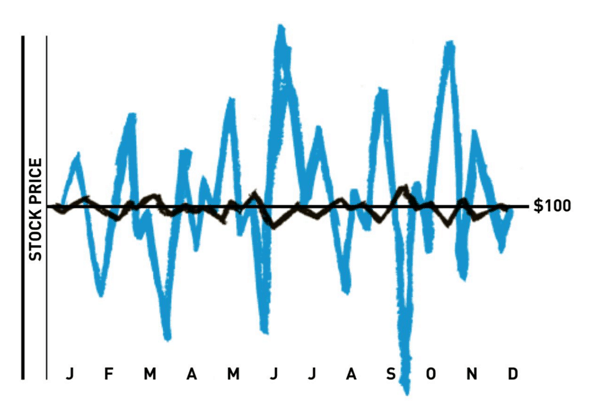
Let’s define the precise numbers we need to look at. Historical volatility is simply the volatility of an instrument in the past. It’s also known as the “annualized standard deviation” of an instrument’s price. In the first figure below, the black line shows the changes in price over time of a low volatility instrument while the blue curve shows the volatility of an instrument with relatively high volatility.
(C/o “The Options Playbook, by Brian Overby, used with permission)
Now to the more interesting part. We can estimate the current volatility of a stock or instrument through the value of its options. In a future article we will explain how options and stock are interchangeable, but for now, I emphasize the point that we can derive an implied volatility of an instrument through the price of the options on that instrument. Why does this matter? Implied volatility is different from historical volatility because the former looks to the future while the latter looks into the past. In fact, the implied volatility is probably one of the most intriguing pieces of data, because it can reveal truths about a company well before such truths are widely known.
Increases in implied volatility generally mean the value of an option on an instrument has increased, while decreases in volatility imply that the value of an option has decreased. Why does this matter? Well remember back to my first article – options’ original purpose was to serve as insurance for a particular investment. For stocks, for example, when there is fear that the price is dropping precipitously soon, options are in higher demand to protect long positions (or more rarely vice versa, say in takeover rumors). Increases in option demand increase volatility and option price, while decreases in demand cause a lowering of implied volatility, and option price.
Implied volatility is calculated to be 1 standard deviation of estimated price in the coming trading year. That means, theoretically, that 34% of the time the stock should be higher by x% in a year or a 34% chance that it will be lower by x % in a year. X is the implied volatility % of the instrument.
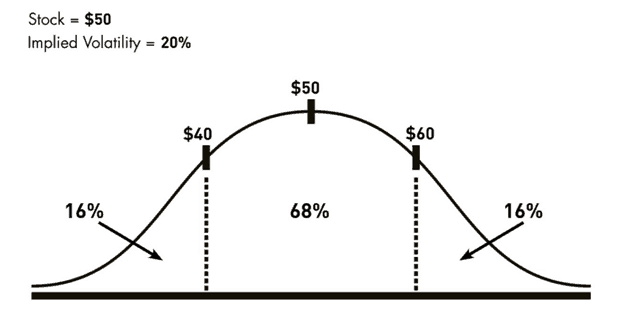
For example let’s look at COP (Conoco Phillips). As of 2/5/17, the price is around $50. Let’s say implied volatility is 20% (it is higher but let’s just consider this for this example). That means in the coming year, the price is predicted to stay within the range of about $40-$60, about 68% of the time, see below.
(C/o “The Options Playbook, by Brian Overby, used with permission)
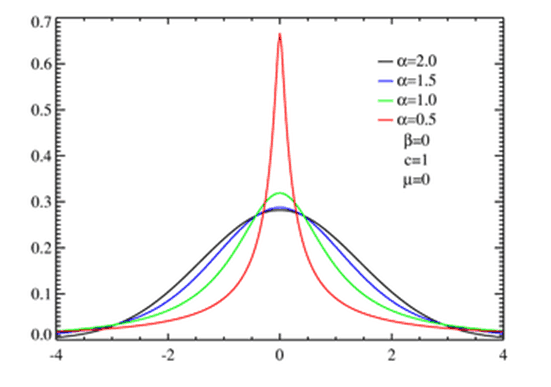
In reality (as discussed in my first article), we know prices of stock follow a Levy distribution, not a normal distribution. This is represented by the green curve vs. the black curve. The actual data says the price actually stays in this range 81% of the time. Because of these two facts we come to the following conclusion: selling insurance (volatility) is consistently profitable, while buying insurance (volatility) is not (and why GEICO reaps profits, and you don’t, or why playing blackjack will always result in a loss to the house).
Ok so far so good. But what if we want to know the volatility just in the next 6 months? Or in the next 45 days? For this we simply multiply the “expected” move by the root of the ratio of number of days in our nested timeframe over the number of days in a year, 365. So for our above stock, if we wanted to know the implied volatility in 45 days we would simply multiply the volatility by the current price, and by the root of the ratio of 45/365. Instead of an expected move of 10 pts in one year, we estimate the stock’s implied volatility to be +/- 3.5 in 45 days, 68% of the time. In reality, it will be +/- 3.5, 81% of the time.
(C/o “The Options Playbook, by Brian Overby, used with permission)
So the bottom line is, stock prices are “boring” most of the time. If we want to be bearish we need to explore strategies that accrue value even when stocks don’t move much. We can find situations where stocks are highly unlikely to increase further, and so we’ll need to find a way to amplify gains in situations with very small gains or losses, or no movement at all. Otherwise we wait in agony for the large drop… which may or may never come in our lifetimes (as per the Pareto principle). In the next section, I’ll elaborate on how you can be compensated for your time, waiting for a move in the stock.


