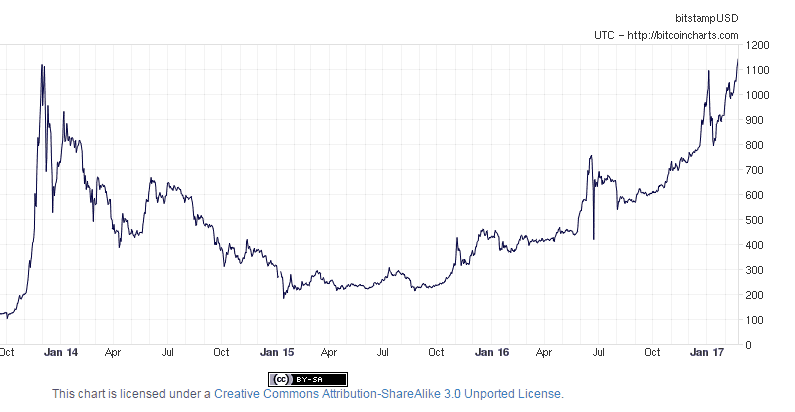
I’ve never traded or owned bitcoin, but I find this chart fascinating:

Slope initially began as a blog, so this is where most of the website’s content resides. Here we have tens of thousands of posts dating back over a decade. These are listed in reverse chronological order. Click on any category icon below to see posts tagged with that particular subject, or click on a word in the category cloud on the right side of the screen for more specific choices.
I’ve never traded or owned bitcoin, but I find this chart fascinating:
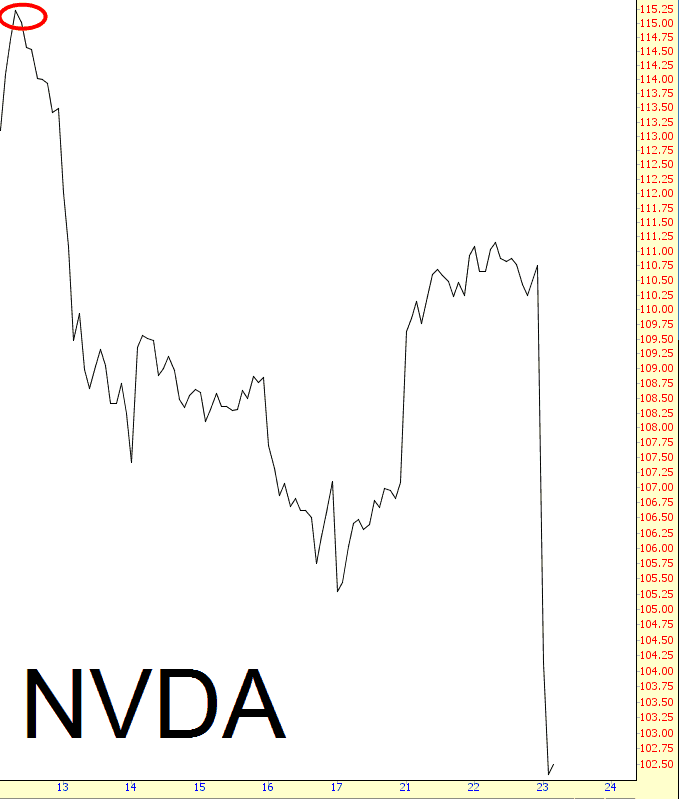
As a follow-up to my February 10th post Green with Nvidia, I just thought I’d point out I called the top almost to the minute. It has, since then, fallen about 12%, and I suspect it’s just getting started.
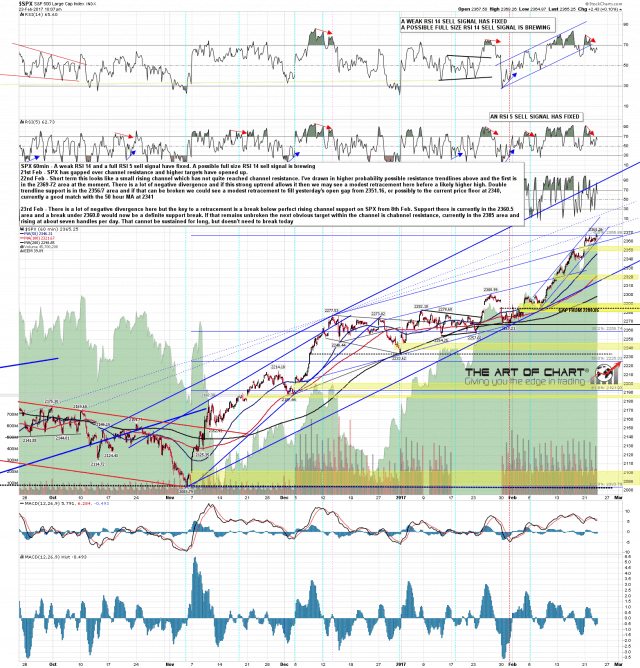
A new ATH at the open this morning but under the hood there were some telling signs of short term weakness both yesterday and in the subsequent move this morning. Yesterday there were some minor trendline support breaks, on the daily chart SPX failed to test the daily upper band, and some sell signals fixed on the SPX hourly chart. When I was doing this chart though I was looking at key short term support at the perfect rising channel from February 8th at 2360.5, and that has now broken, putting SPX in a likely short term topping process, though Stan and I don’t think that the swing high is in yet. SPX 60min chart: