
The more I use SlopeRules, the more excited I get about it. I’m excited about it as the owner of the technology, and I’m excited about it as a trader/user of it. This is a whole new discipline for me, and I find it mesmerizing.
Although we now have a number of indicators in the system, I wanted to offer a couple of examples with moving averages. I did a search for the best moving averages and stumbled upon a couple of articles. This one from Benzinga declared that “Among short- and long-term EMAs, they discovered that trading the crossovers of the 13-day and 48.5-day averages produced the largest returns.” OK, interesting! So I put that together:

Let’s use the “Test” button to see how that does:
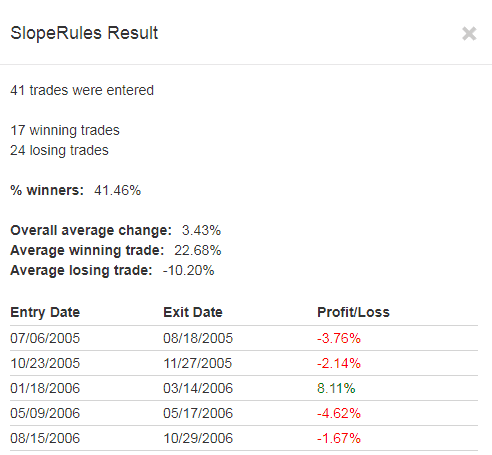
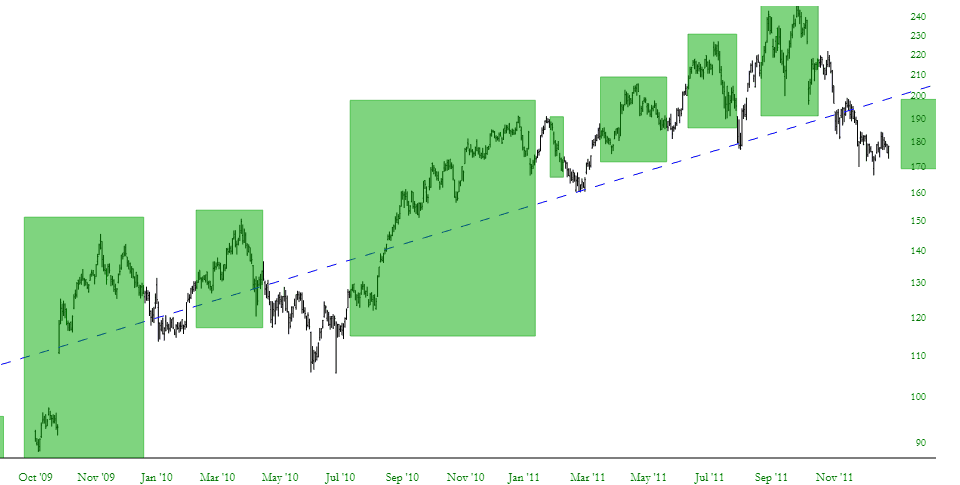
Hmmm. Not that impressive. How about Amazon with the same ruleset?
Well – – it’s OK. We can see that in graphic form too in SlopeCharts.
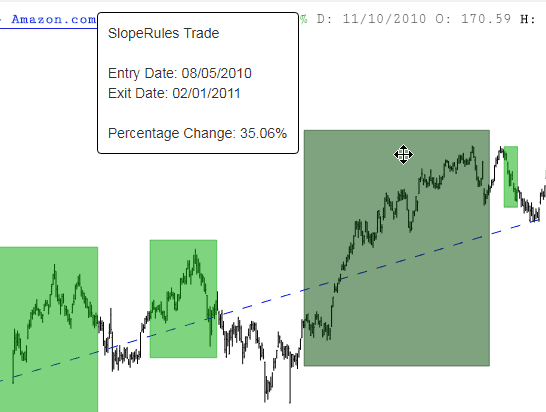
And, as I mentioned in the video, you can now point at any rectangle and see the details:
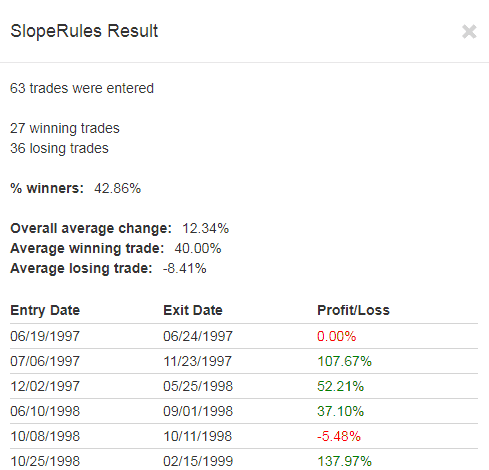
I’m not exactly amazed at the results, in spite of their claim, so I tried a different article. This one was from the ETFdb site, and it spoke favorably about a 5/10/30 crossover system. Fine, let’s give it a shot.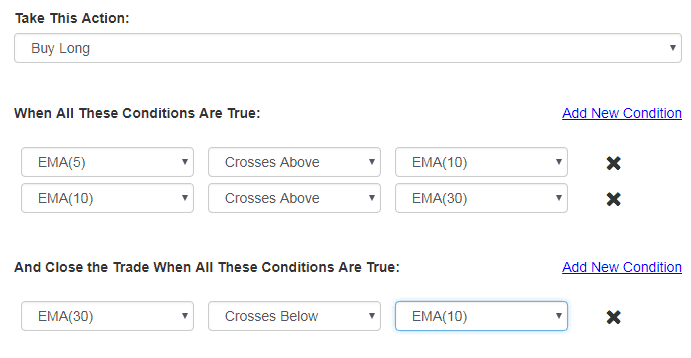
And we’ll try that “Test”………..
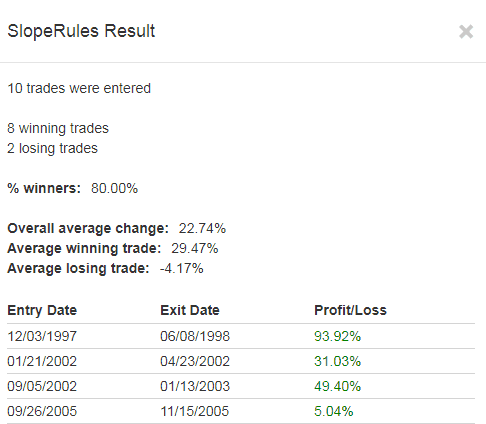
MUCH better! I think you can see how this kind of experimenting can become so captivating. I’ve already piled on a ton of feature requests and tweaks. You can count on SlopeRules getting better all the time. I want you to experiment with it and share your best ideas with me.
