
A number of folks have sent me congratulatory emails about my “call” for the ES to reach 2600, since our highest price thus far was 2599.50 which, let’s face it, is pretty close. This clip comes immediately to mind:
If we turn IMMEDIATELY lower and really start selling off next week, sure, absolutely, let’s start planning my statue. But the only “victory” this week was getting really, really, reallllllllllly close to my target. Indeed, strictly speaking, the actual “line” is at 2613 or something like that. I just offered 2600 since it’s a psychologically-satisfying figure.
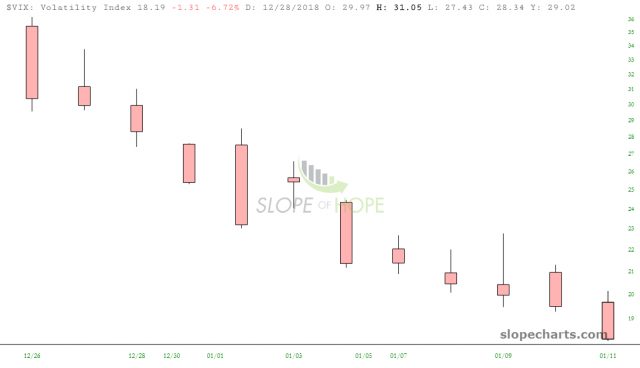
One thing Mnuchin has done with dazzling success over the past two and a half weeks to snuff out volatility. When’s the last time you saw anything even close to this?
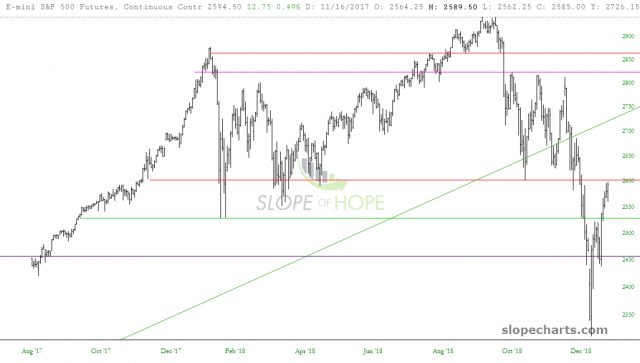
As I said, the figure I’ve had in mind since Christmas has been 2600, which is that red horizontal line that we almost perfectly touched this week. Could it push higher from here? Absolutely. Would that be disappointing to me? Definitely. Is this the last rhetorical question? Indeed it is.
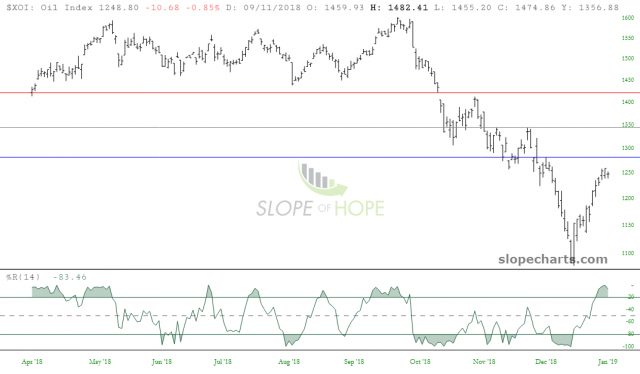
Just about every asset is at the “you really should turn lower from here” stage. I’ve provided the CCI with each chart below to illustrate its overbought nature. Here’s the oil index:
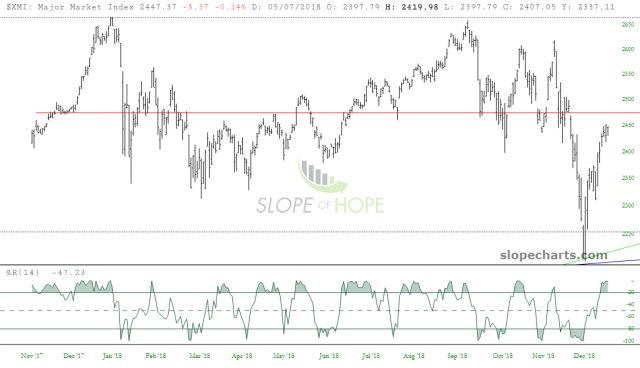
The Major Market Index:
And the S&P 500 cash index:
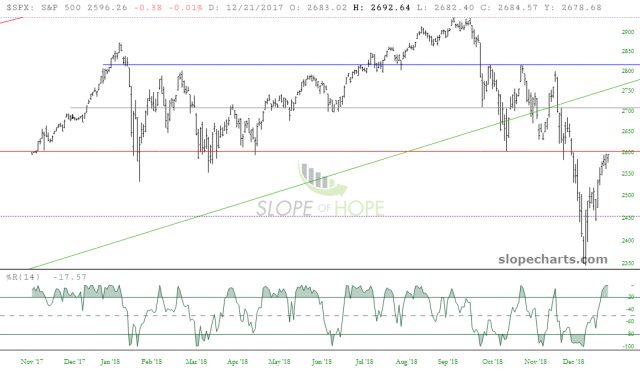
Presently, I’m a combination of anxious and excited. If you asked me to draw a bunch of hypothetical charts to illustrate a picture-perfect setup for a major market selloff, I could not do any better than the charts we’re seeing right this second. On the other hand, my This Is Too Good To Be True warning light is flashing frantically. Only next week will reveal to us whether the worry was warranted or not.
