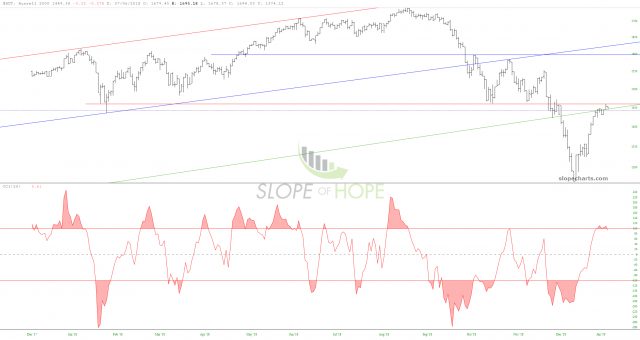
I’ve made the indicators king-sized for clarity, but here is the Russell 2000 ($IWM) cash index with the CCI indicator from SlopeCharts:

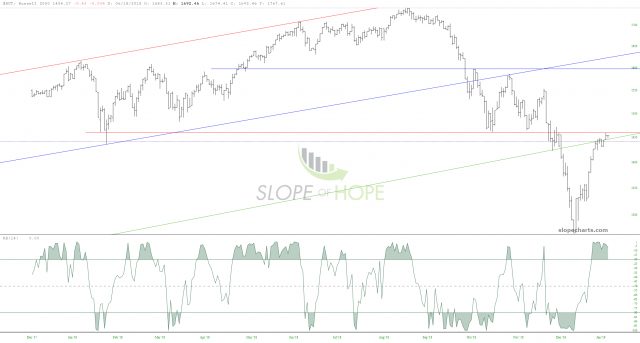
And the same index with the Williams %R overbought/oversold indicator:


I’ve made the indicators king-sized for clarity, but here is the Russell 2000 ($IWM) cash index with the CCI indicator from SlopeCharts:

And the same index with the Williams %R overbought/oversold indicator:
