The pivot point support/resistant values/targets for the S&P 500 Index (SPX) for the entire month of May are based on the high/low/close of the April monthly candle, as shown on the following pivot point calculator.
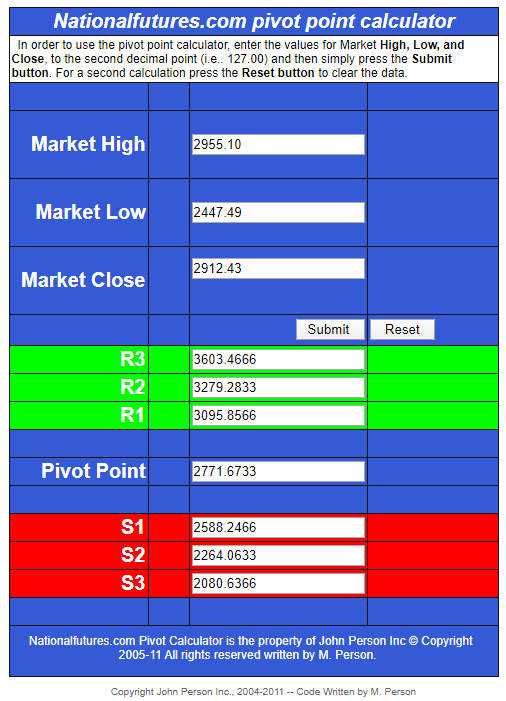
Source: nationalfutures.com
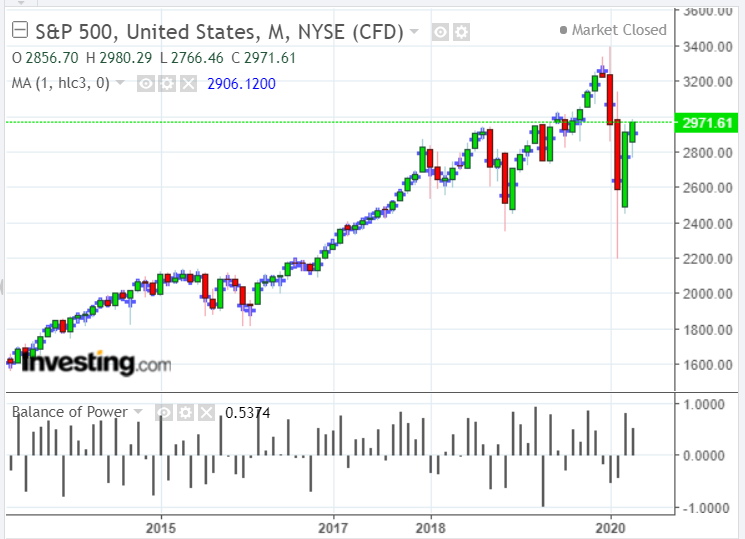
The PP of each monthly candle is depicted as a blue cross on the chart of the SPX below.
You can see, at a glance, where the current price is relative to those…giving an indication as to its relative strength/weakness as the price moves above/below each one in the coming days/weeks/months.
As of Wednesday’s close, it’s well above March and April’s PP and below January and February’s PP. Price has fought through all of 2018, half of 2019, and well over half of 2020’s overhead resistance since the March low, with relatively less (and recent) overhead resistance left to overcome.
R1 sits at 3095.86, which is slightly above the PP for February’s candle at 3067.86. Both of these price levels will act as near-term resistance, as well as targets.
The closer the SPX gets to its all-time high at 3393.52, the nearer the Balance of Power will reach an overbought condition. However, that does not automatically mean that it will sell off at that point or that the price can’t go much higher. Rather, it may just continue to rally more slowly over time.
Near-term support sits at April’s PP at 2771.67. A drop and hold below that level may see price reach S1 at 2588.25, or lower.