
For all the fuss and bother about “Quad Witching Day”, there’s not much going on. As I type this, the ES and NQ are down less than half a percent, the small caps RTY is up 0.7%, and the otherwise maniacal $BTC is down a quarter of a percent. Yawn.
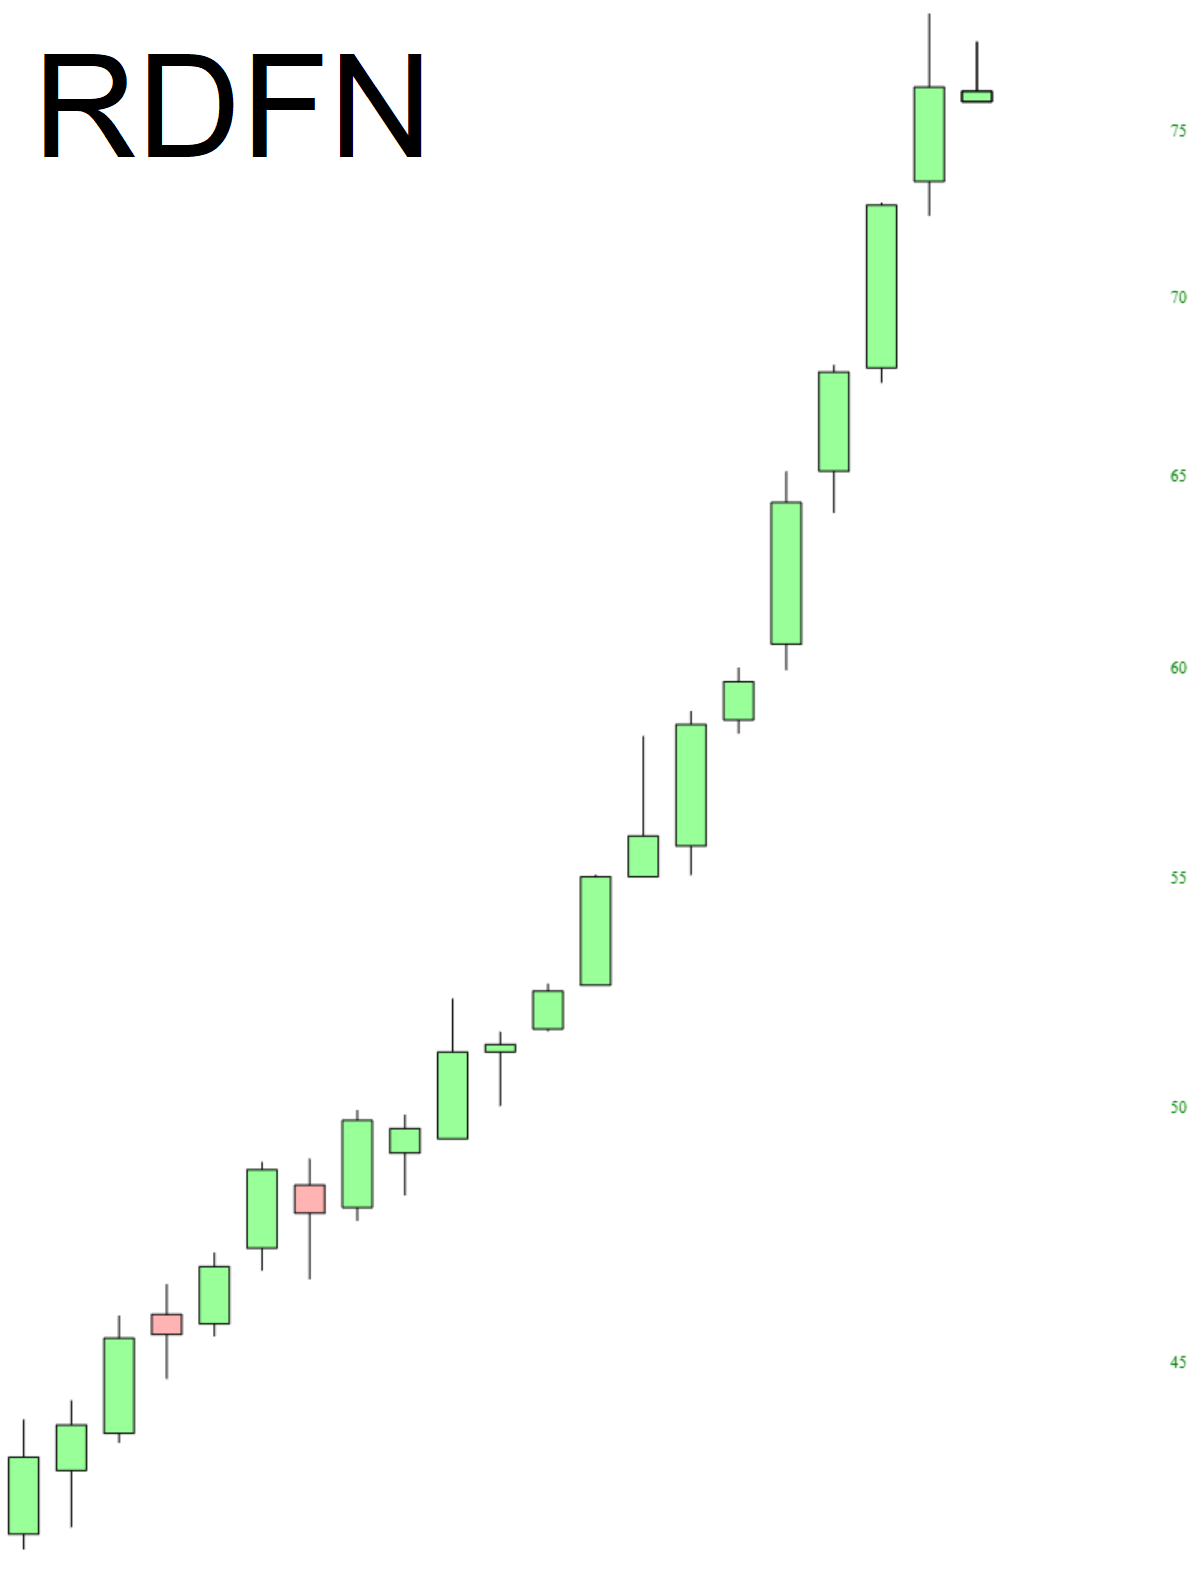
The poster child of this market, Redfin, continues to notch its 375th “up” day in a row, although it’s looking a bit flush in the cheeks:
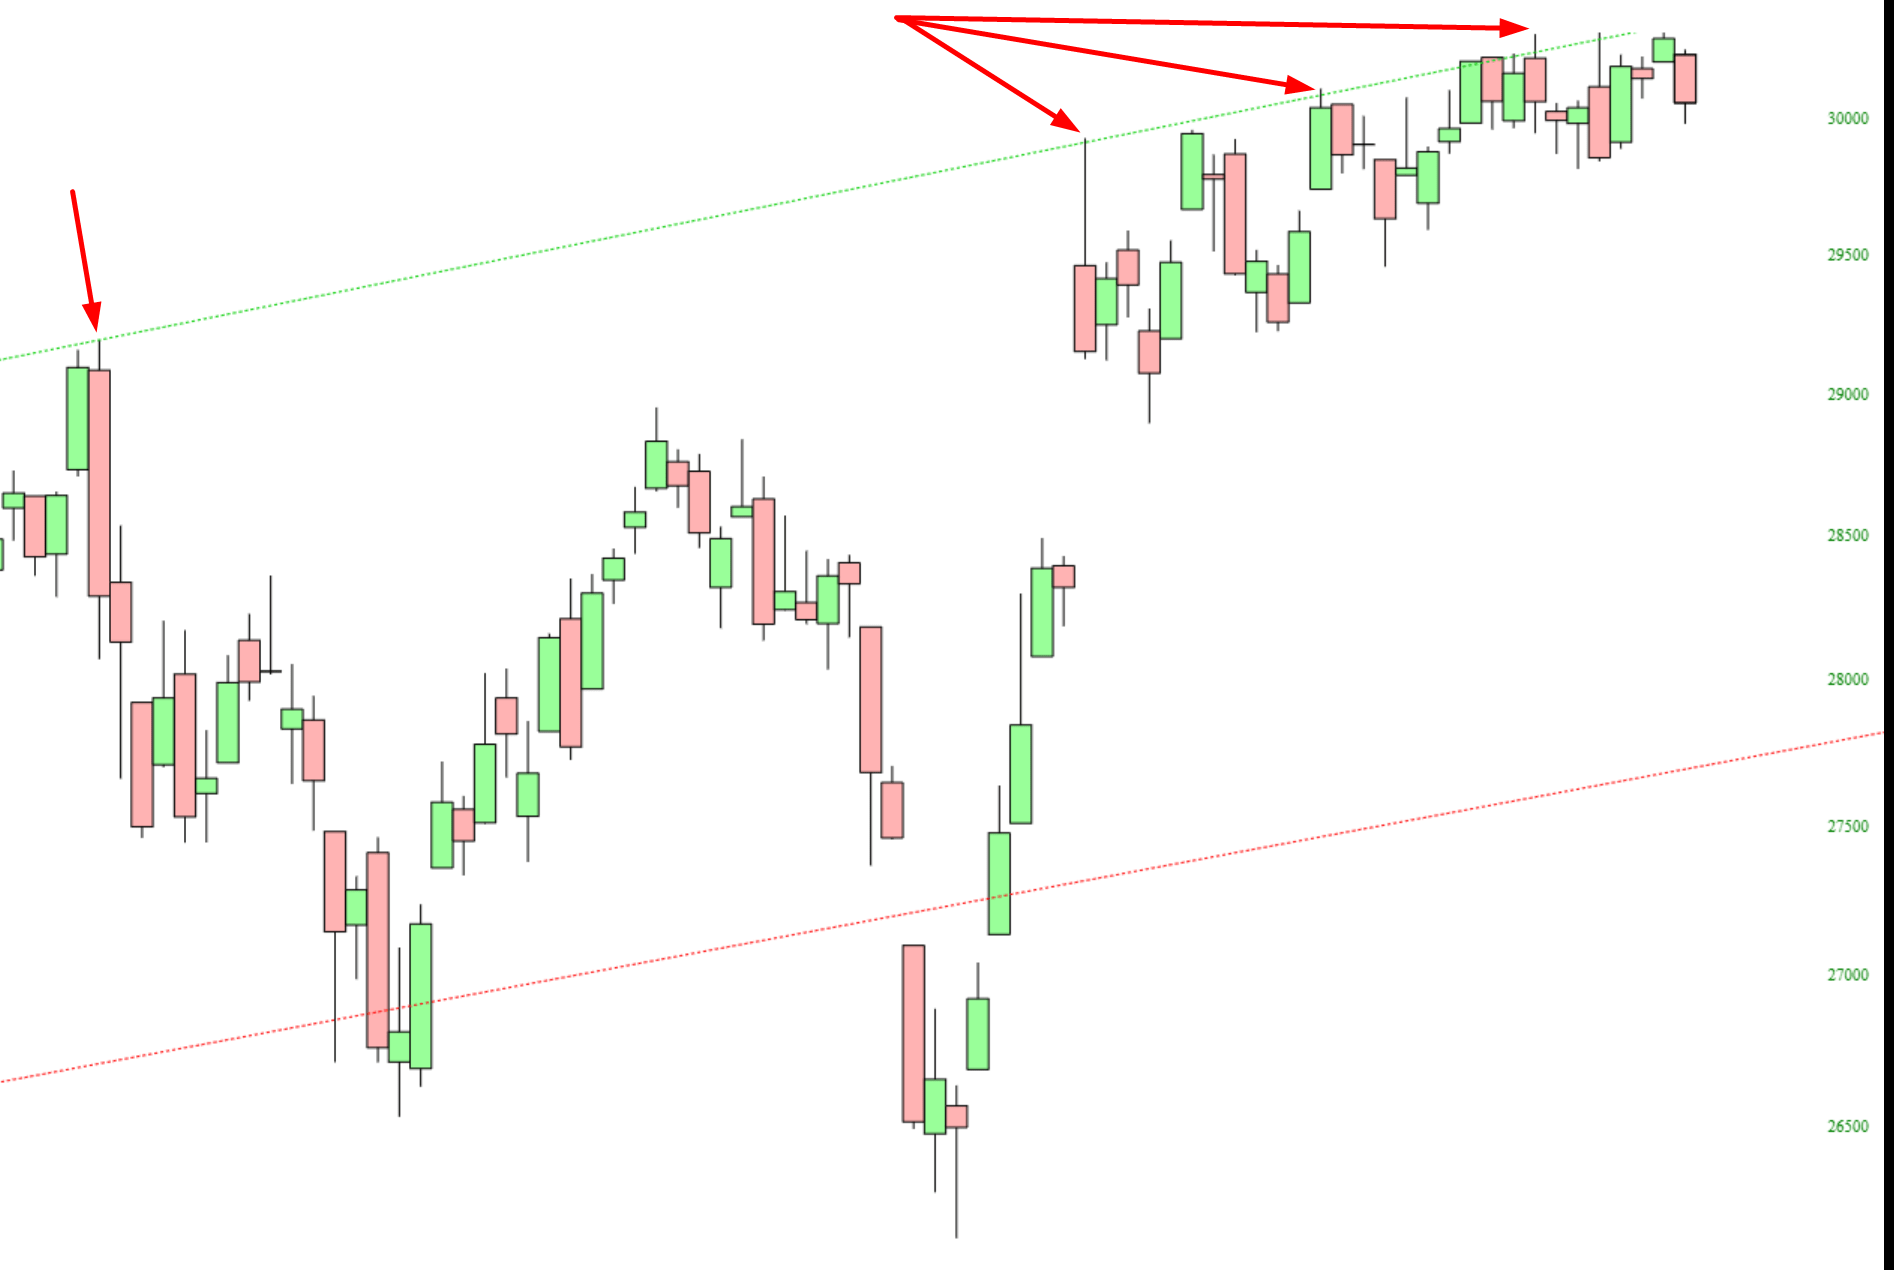
I would like to point out the interesting phenomenon going on with the Dow Industrials. The trendline in question goes back about 17 months. Early in September, the Dow tagged the line and immediately flipped lower. Over the past month, however, it has clung to this line like a child who can’t swing clinging to a parent. The prices are this trendline are absolutely smashed together. So if you are finding this market to be dull, now you know why.
One chart I find vastly more interesting is the Major Market Index, which has hit a pitch-perfect resistance point. That green trendline, by the way, is not trifling matter. It goes back to the March 2009 bottom. In other words, it’s the biggest of the big, and should this mark the peak for the $XMI, it will be one of the most incredible trendline reversals I’ve ever seen.

