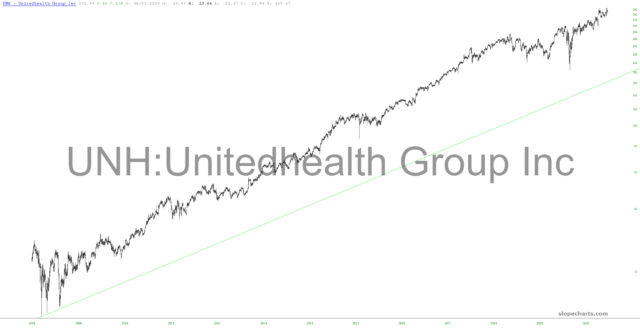
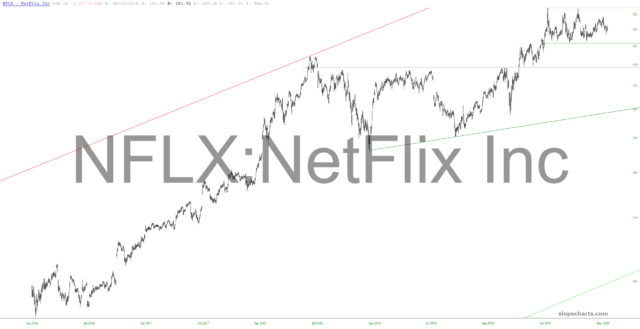
Preface to all parts: over this long weekend, I wanted to share some of the most interesting charts of companies that will be doing earnings announcements this week. The timing of the announcement for this group is in the subject line.

Slope initially began as a blog, so this is where most of the website’s content resides. Here we have tens of thousands of posts dating back over a decade. These are listed in reverse chronological order. Click on any category icon below to see posts tagged with that particular subject, or click on a word in the category cloud on the right side of the screen for more specific choices.
Preface to all parts: over this long weekend, I wanted to share some of the most interesting charts of companies that will be doing earnings announcements this week. The timing of the announcement for this group is in the subject line.

For those who don’t know, GEX stands for Gamma Exposure. It is an options-based LEADING indicator that is derived through a calculation of all the gamma at all strikes and expirations on any given day in the S&P500 Index. The chart is free to access and can be found here.
High Gamma = high pushback against selling and Low Gamma = low pushback against selling.
As of Friday’s close, Gamma Exposure hit a very low point. A key point in a couple of ways.
The first is that it was less than 1.5B. When gamma gets this low it tends to be associated with falling prices and increased volatility.
The second is that GEX broke its uptrend line. I’m the only one I know of that uses it this way. You see, a little while back, I was doing some ongoing testing and analysis of the GEX and noted that it seemed to trend along with the SPX. Out of curiosity, I drew some UTL’s and plotted what happened when they broke down. I was surprised and amazed at the results. It was consistent going all the way back to the start of the data in 2011. Red dots are when GEX is <1.5B (GEX above, SPX below).
(more…)Preface to all parts: over this long weekend, I wanted to share some of the most interesting charts of companies that will be doing earnings announcements this week. The timing of the announcement for this group is in the subject line.
