
No one can deny that bonds have absolutely stunk up the room for two solid years. Would that equities looked anything like this! Slope would rival Google in terms of traffic! In any case, this is TLT for 24 months solid:
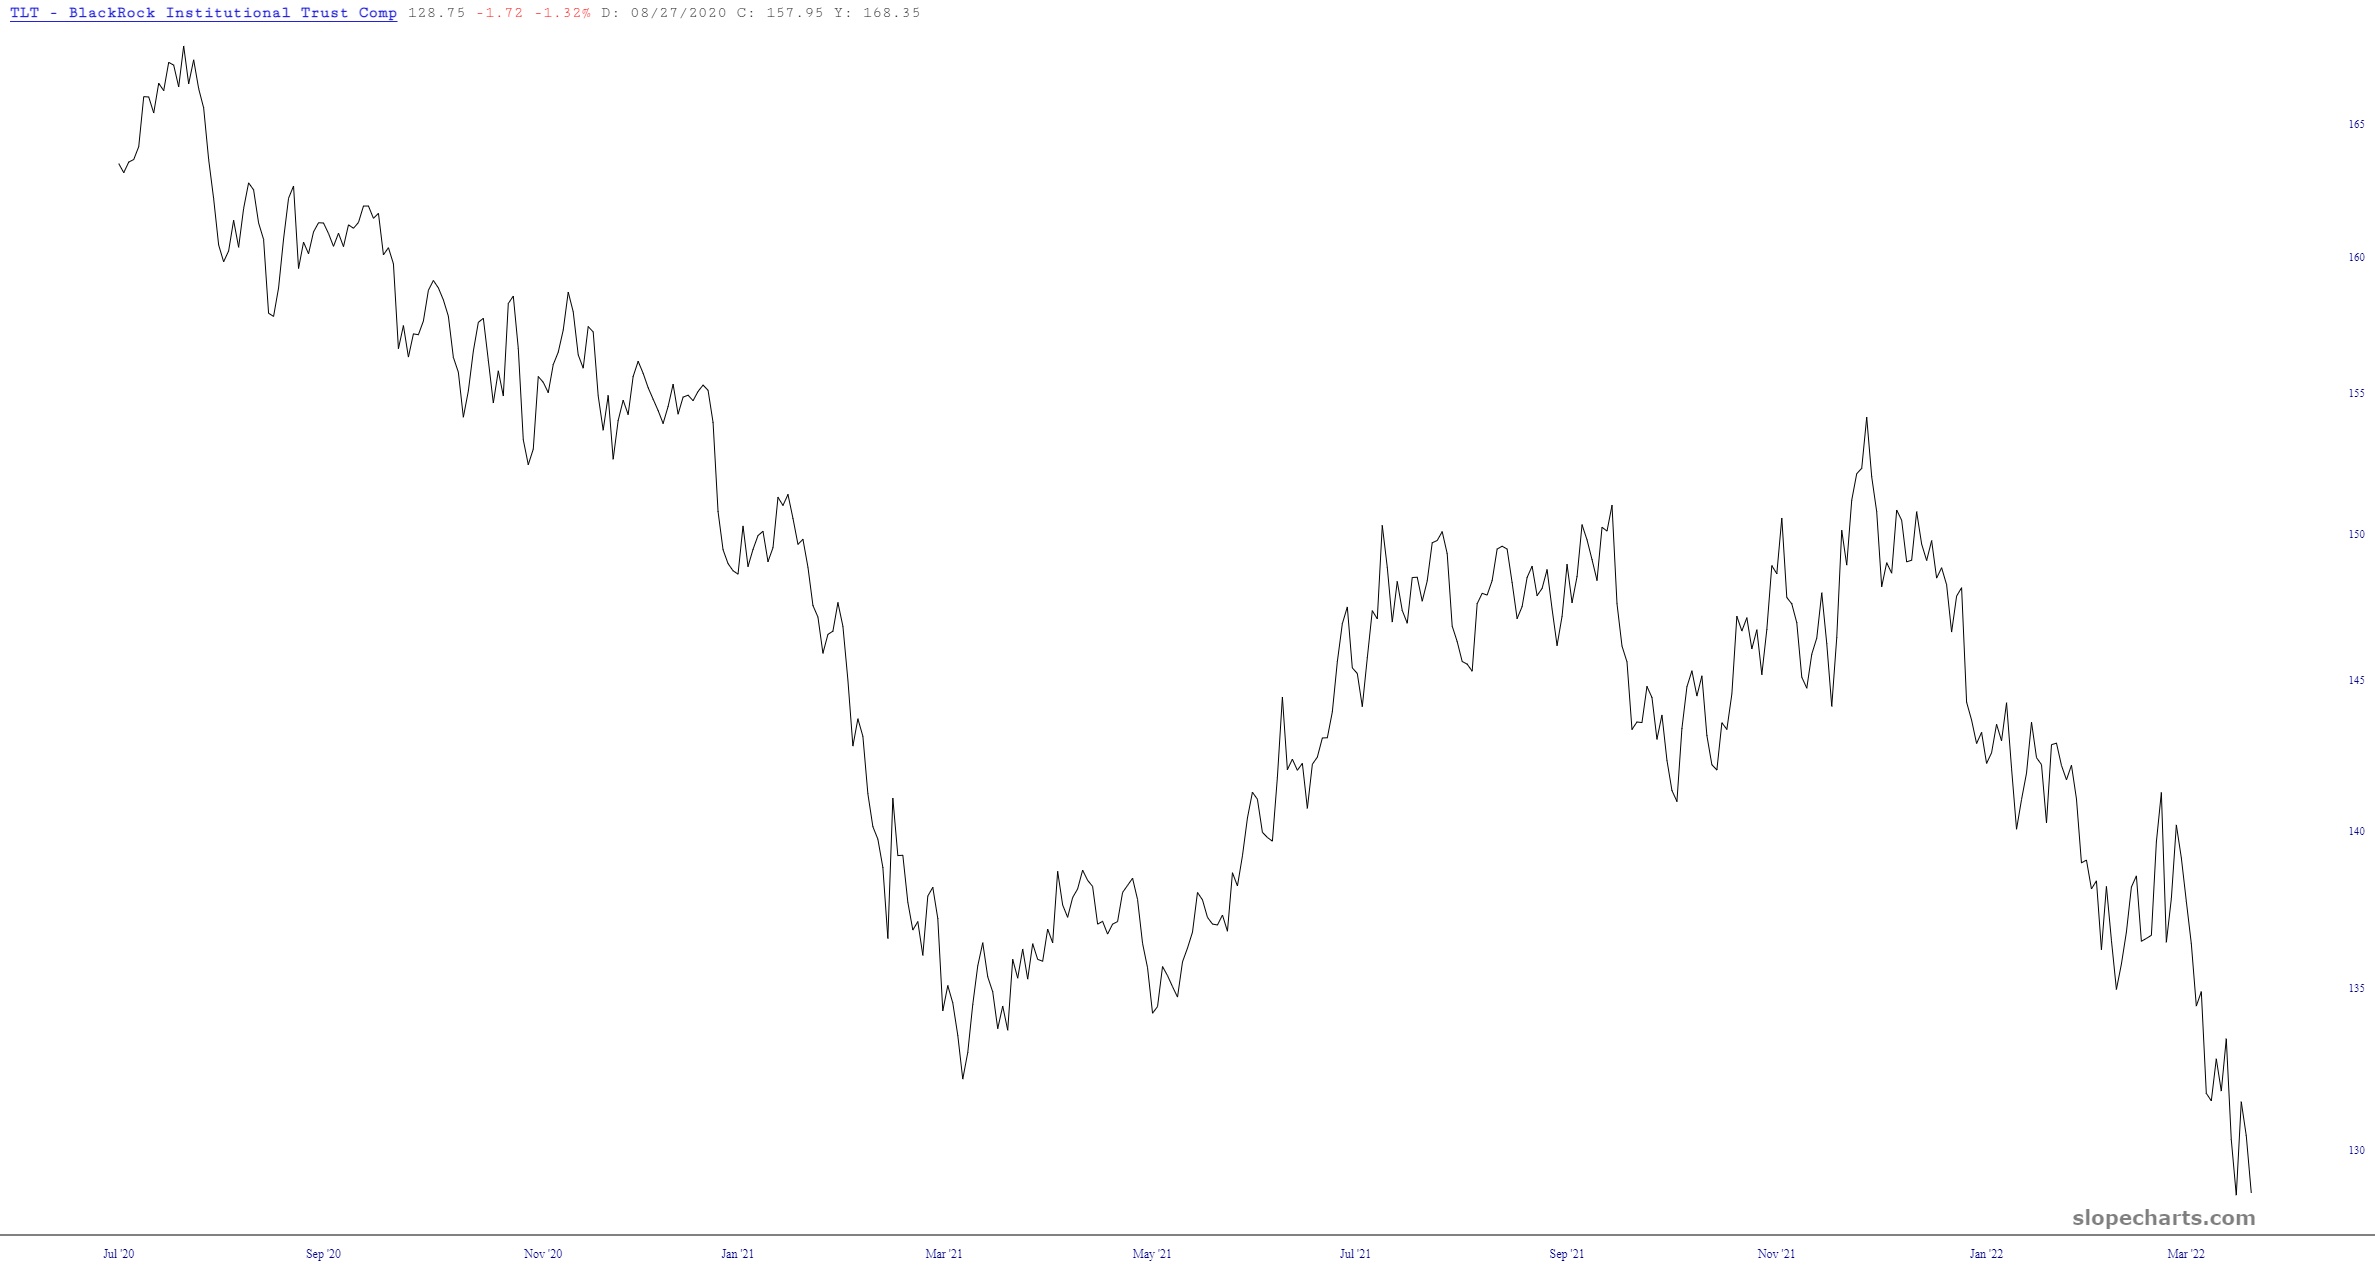
This is a big deal, of course, because plunging bonds mean rising interest rates, and rising interest rates, much like rising crude oil prices, represents bad news for most people (the banks notwithstanding). I would like to point out a few things that suggest bonds might not have much farther to go.
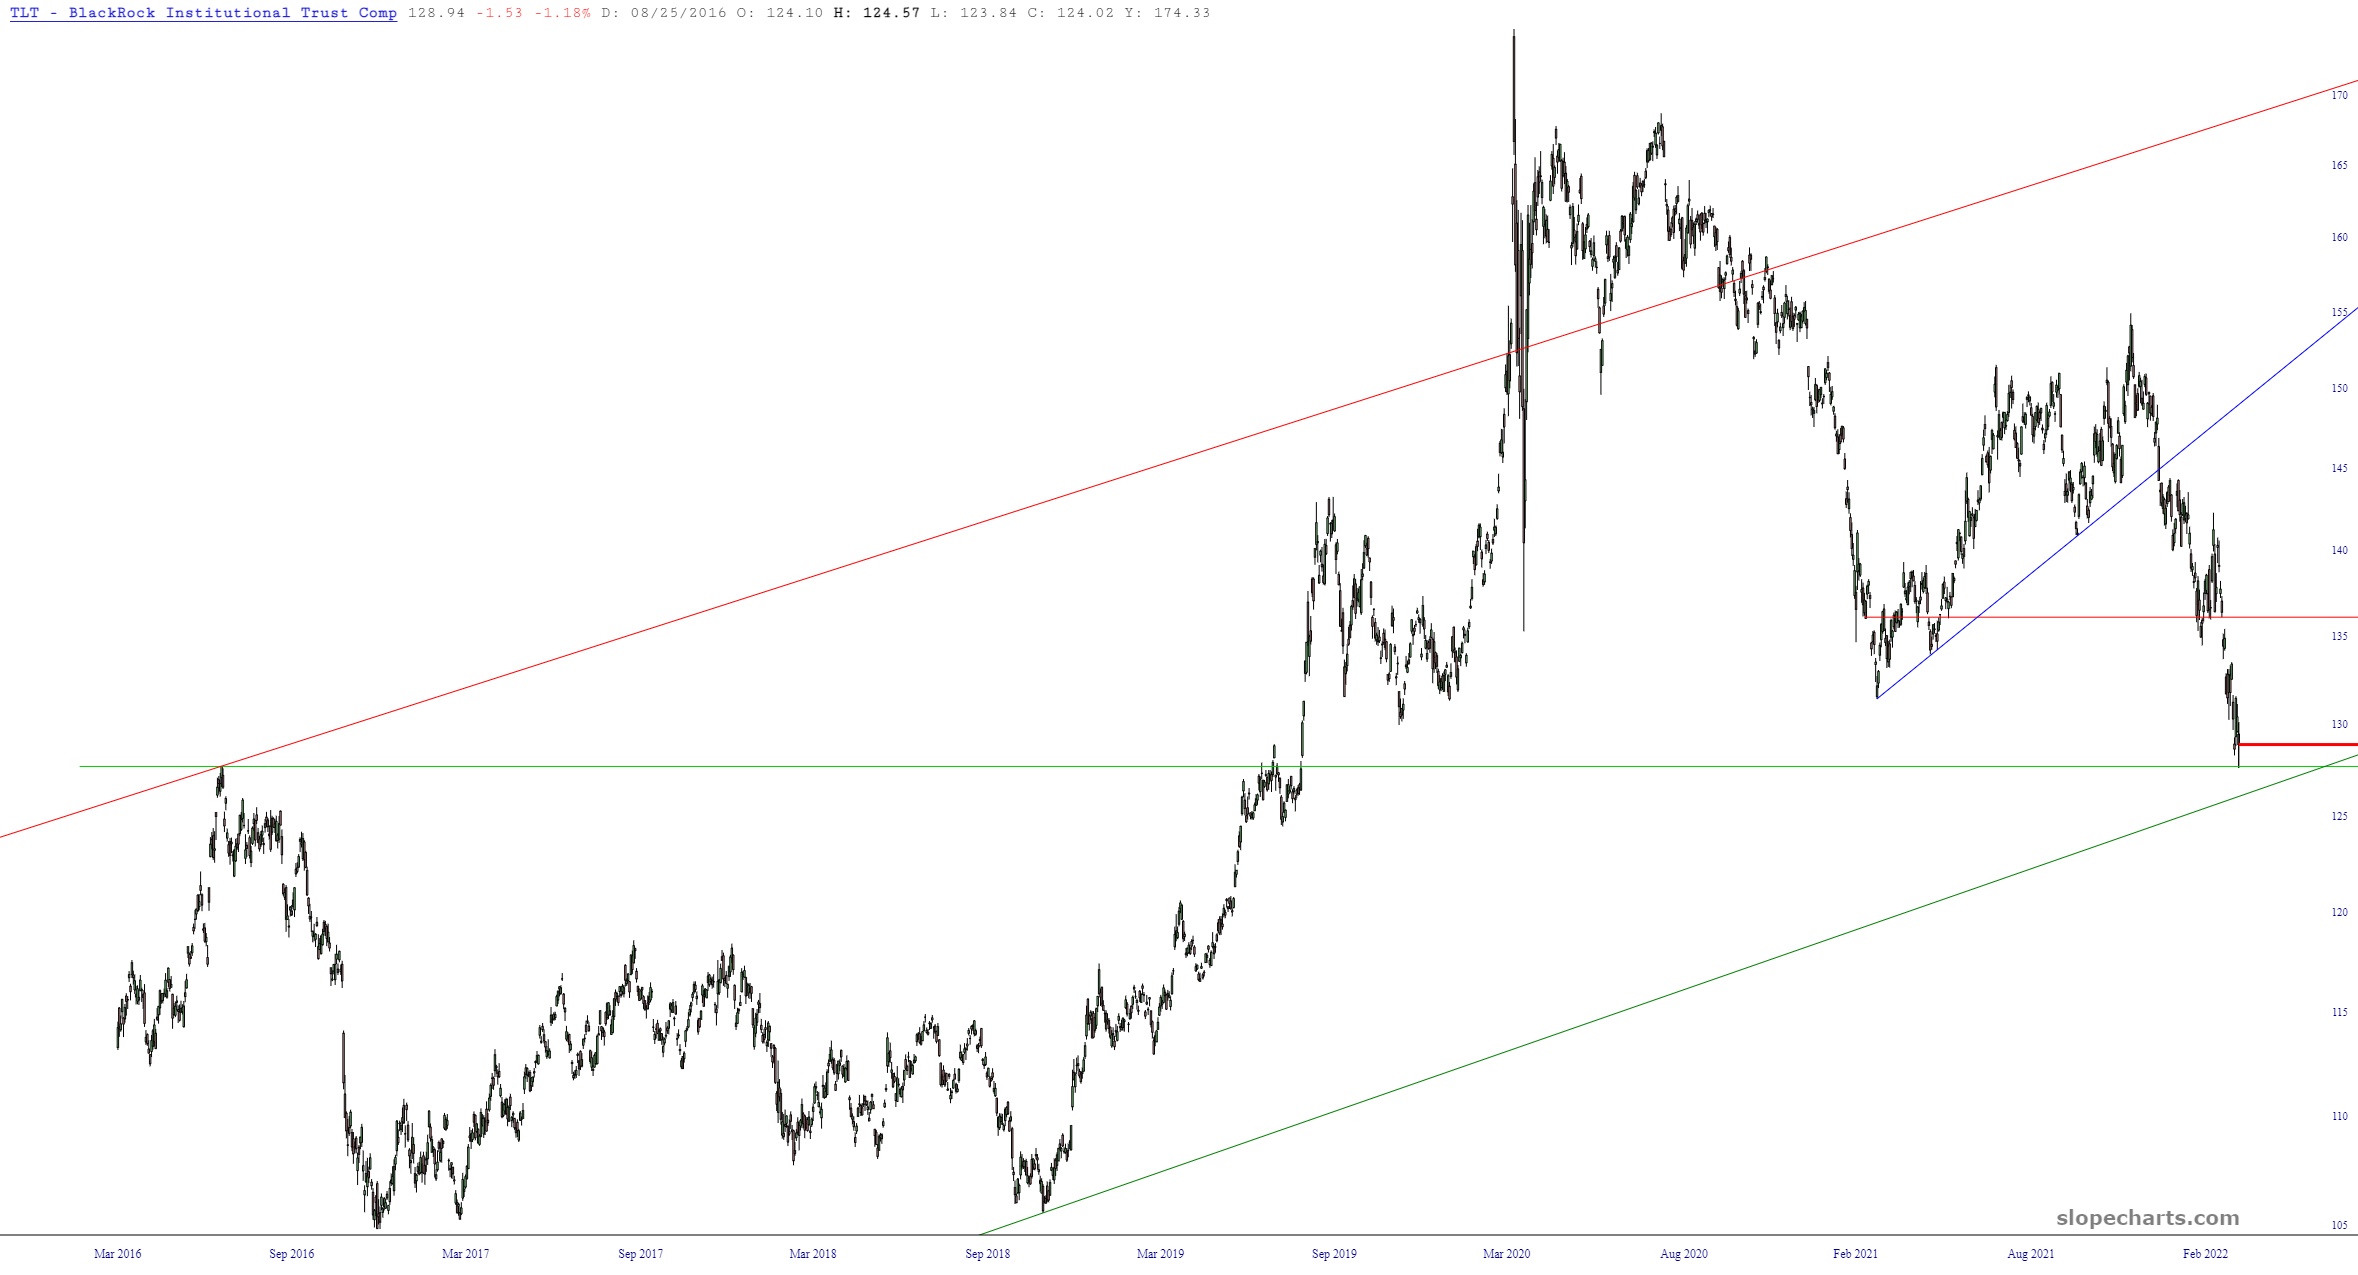
Here, once again, is TLT. Its price is approaching not only a long-term supporting trendline but also the breakout level which preceded its explosive move. It’s hard to believe, but a person buying TLT in July 2016 when Obama was still in office would be sitting pretty on a 0% return, including dividends, after holding tough for that long.
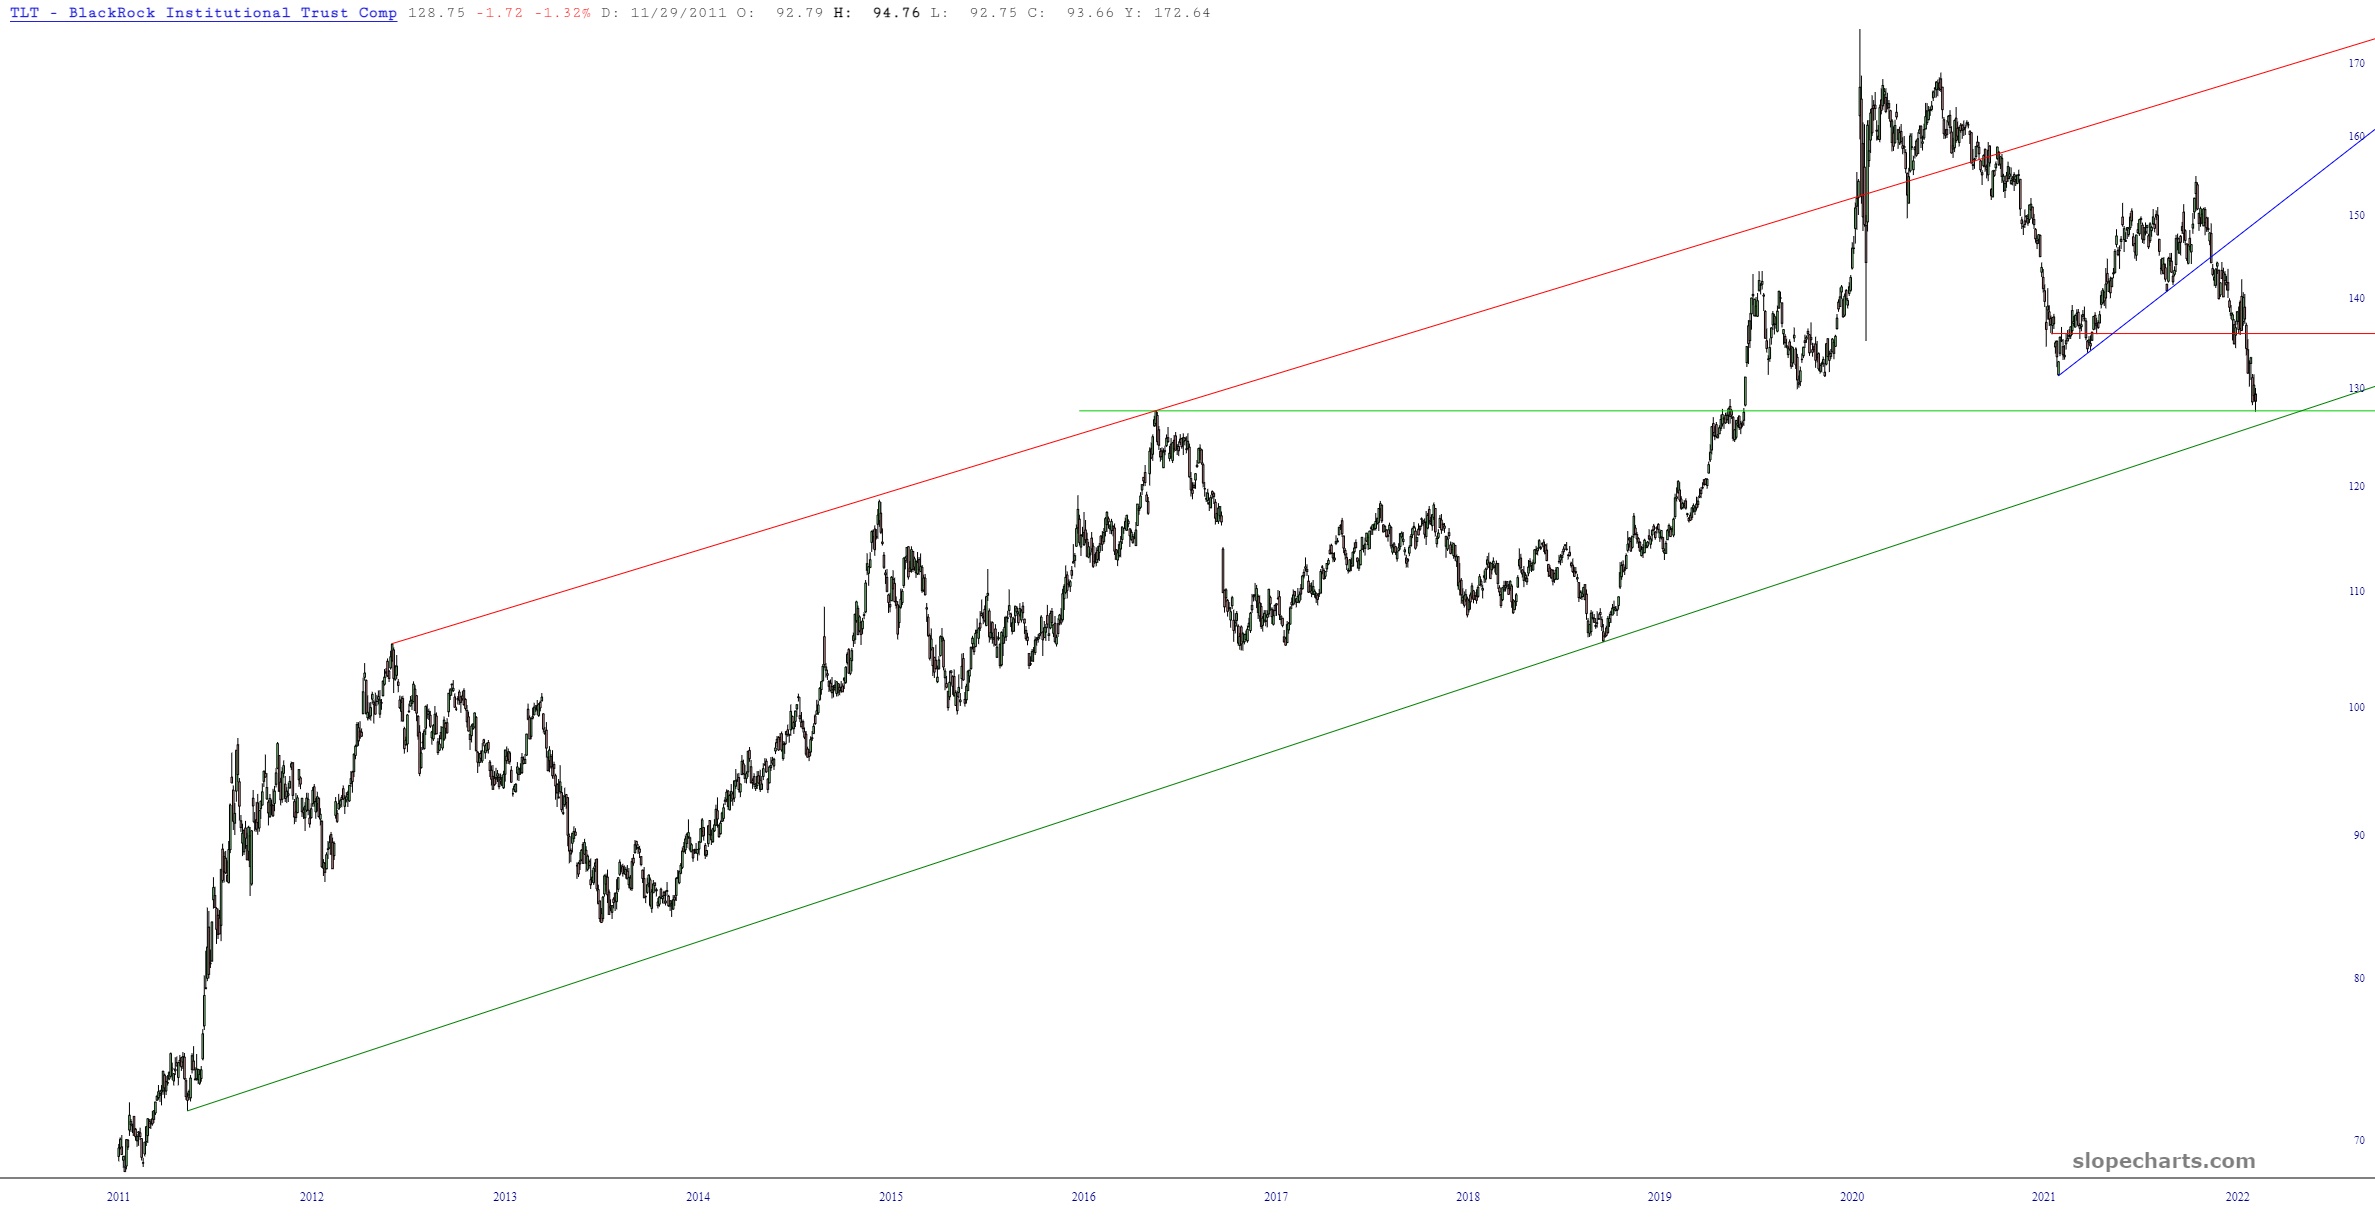
Look at the really long-term picture, however. Prices have stayed within this channel with the exception of the absolutely madcap circumstances of the Covid crash.
But here is the most important chart of all, which is the continuous contract of the T-bond futures (symbol /ZB) which goes back for decades.
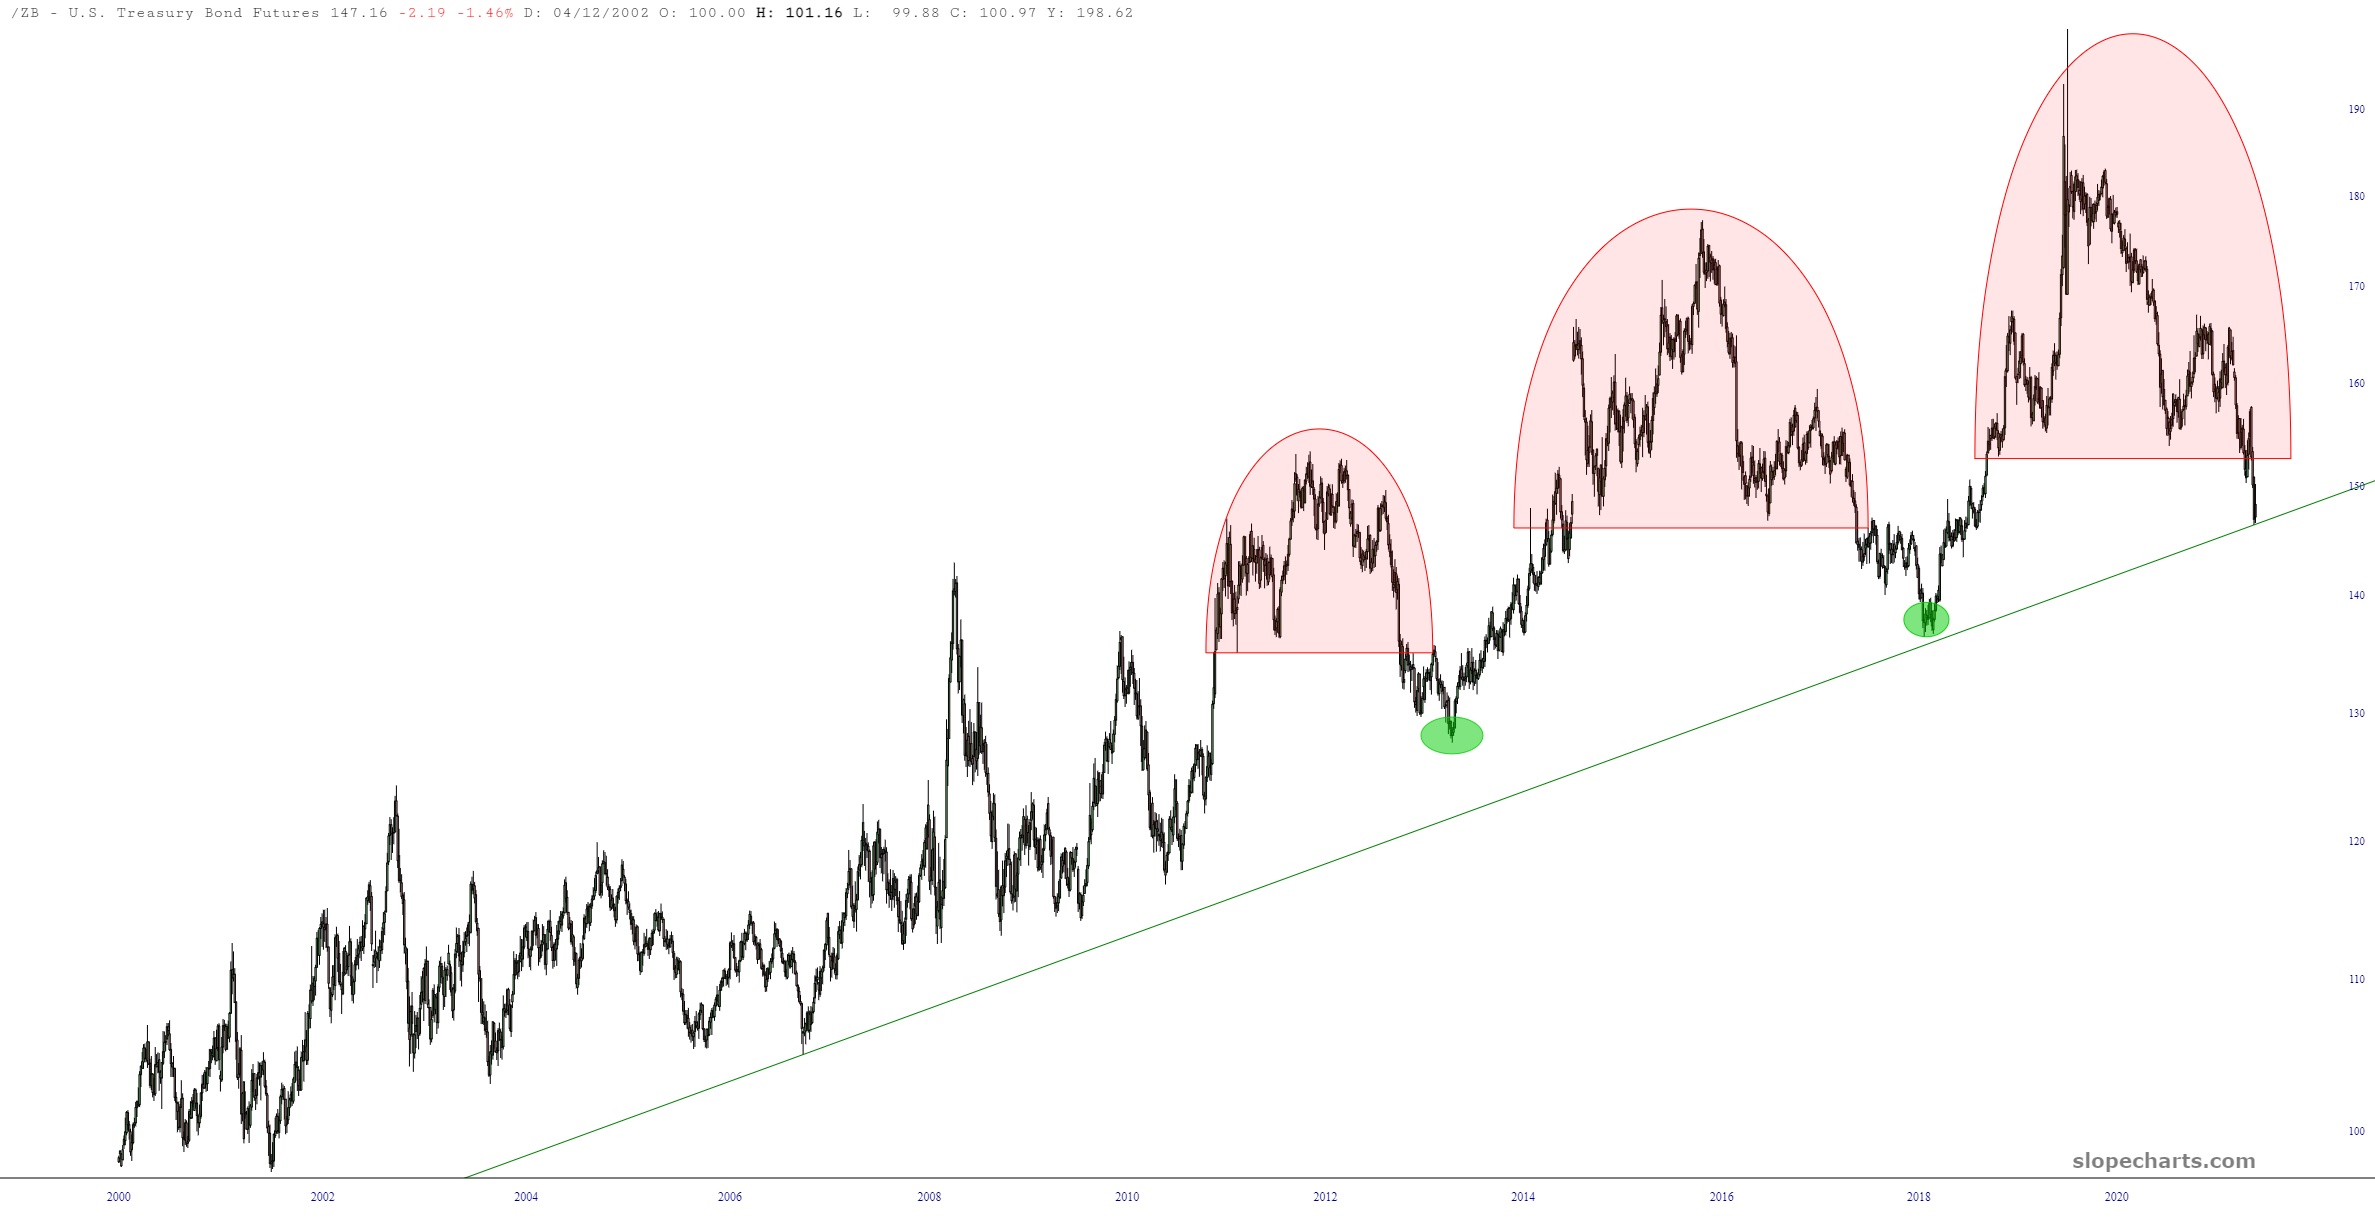
On the one hand, a person could look at the most recent tinted area and declare it a massive head and shoulders pattern, suggesting vastly lower prices ahead. I have done this myself in times past.
However, we’ve seen this movie before. Look at the trio of “tops”, particularly the middle one. There is a remarkable similarity here, inasmuch as a huge topping pattern seems to be in place, the snare drums start rolling, the fall starts happening, and then………...green circle!…………it stops.
So I’d suggest that, if nothing else, that supporting trendline on the /ZB is incredibly important, because if it breaks, we are going to witness an economic shift that I don’t think we’ve experienced in our lifetimes. Otherwise, we could be nearing the end of what has been a hearty two year bear market in bonds.
