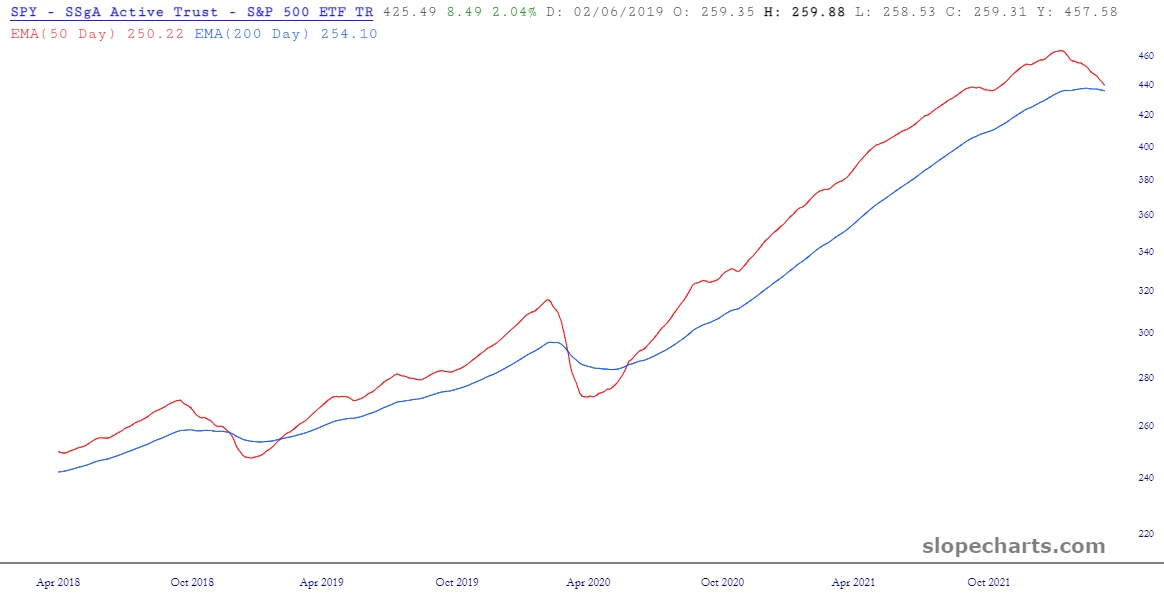
I have been banging the table for weeks to watch for the fabled death cross. While it is not a guaranteed lotto ticket, as a speculator I am simply looking for clues. Big clues as I place larger bets.
There are a few instances where the drawdown is nil. But note, there are none that show 5%+ gains. So the success rate from the death cross to the 50 day crossing up over the 200, is fairly accurate. Do not mind charlatans that also say, ‘In x months after the death cross, we actually saw gains in these years.” It is the same as “if you sell now you will miss the best rally” or “over a long time horizon the markets always are up.“
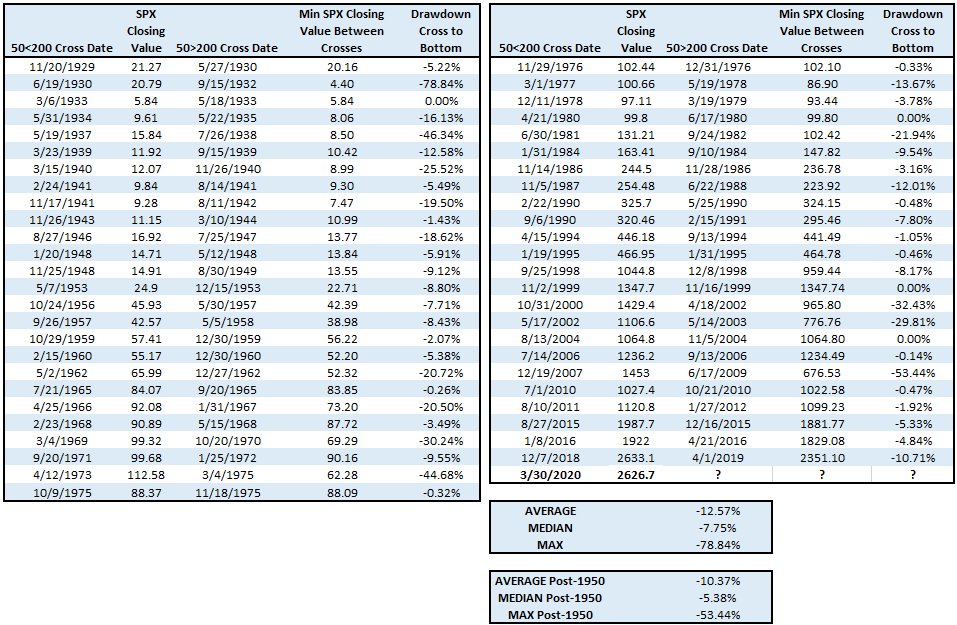
From 1929 – 2019, there was an average drawdown of -12.57%, median of -7.75%, and maximum of -78.84% (1930).
From 1950 onward, there is an average drawdown of -10.37%, median of -5.38%, and maximum of -53.44% (2008).
The drawdown column uses the closing value of the death cross initiation date for SPX and subtracts the lowest closing value for SPX over the timeframe until the 50-day moved back above the 200-day.
But maybe this time is different! Take a close look: