
Well, happy weekend Slopeland! I hope it has been a good start to 2022 for you. It has certainly been an interesting and profitable year thus far, which brings me to today’s post. I try to compose posts around what I perceive to be key turning points in markets, and I think our current market qualifies. Today, I want to try to bring some closure to what has been my baby of late… crude oil. I will also discuss interest rates, and the outlook for the S&P 500 for the remainder of the year. Let’s take a look!
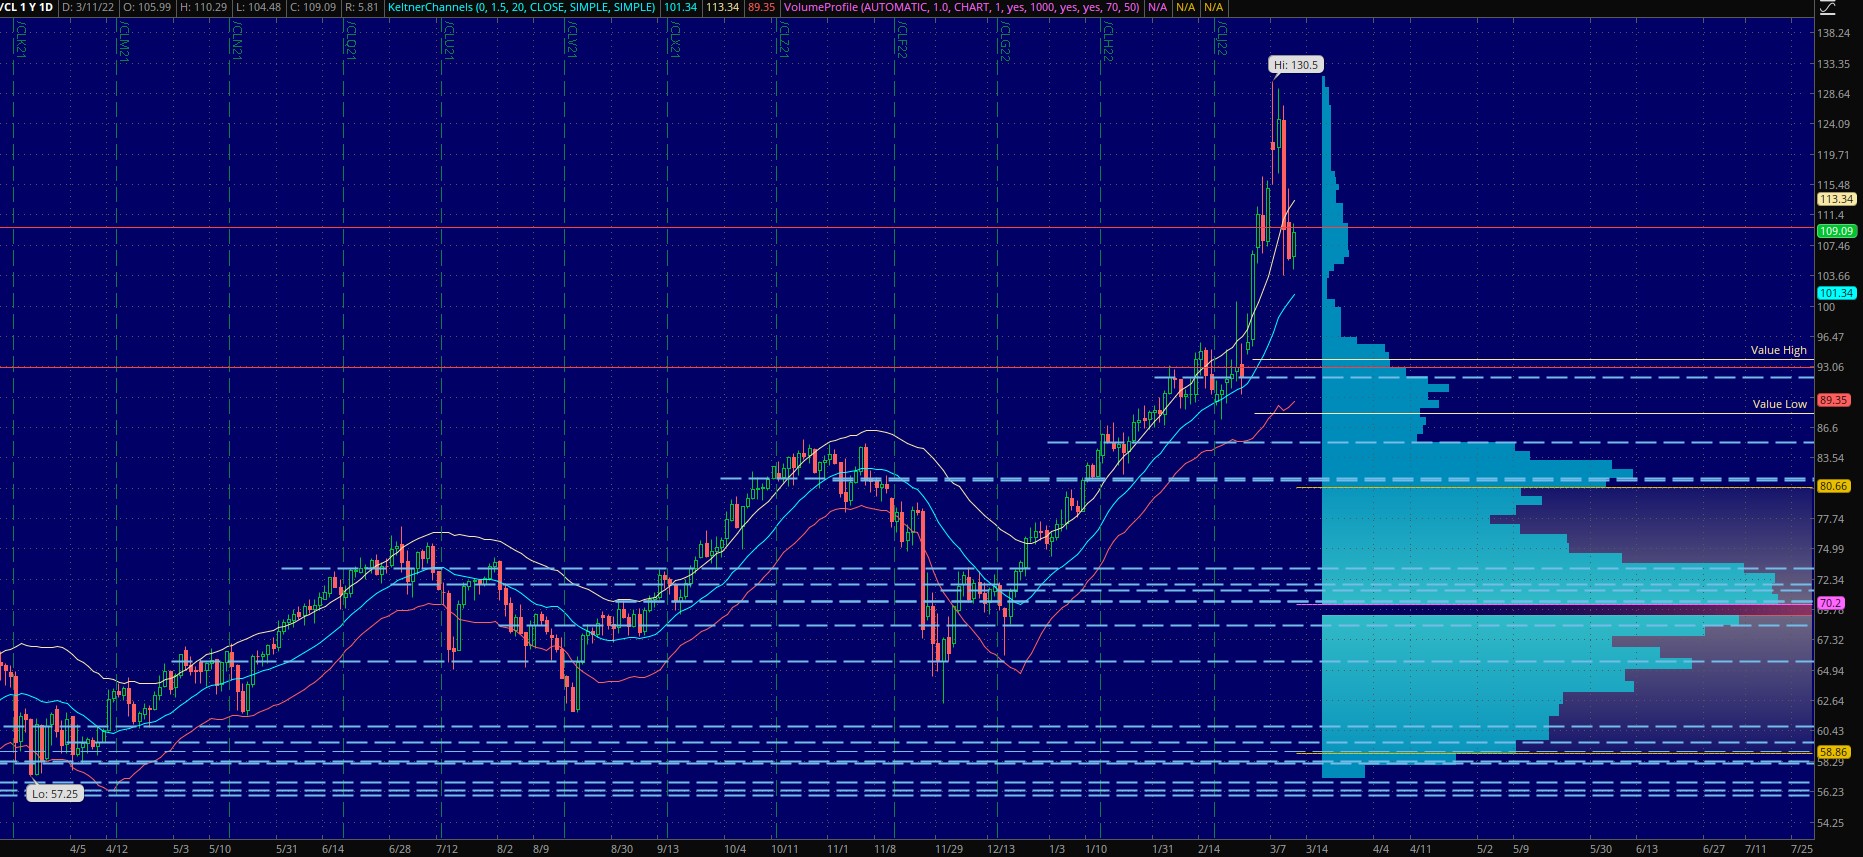
Below is a one year chart of the monstrosity that has become crude oil. I have been heavily involved in the energy space for nearly two years now, coming off the Covid crash low. On Monday through Wednesday of last week I sold off all of my energy-related positions. Why did I do that, and what do I think is ahead for the oil market?
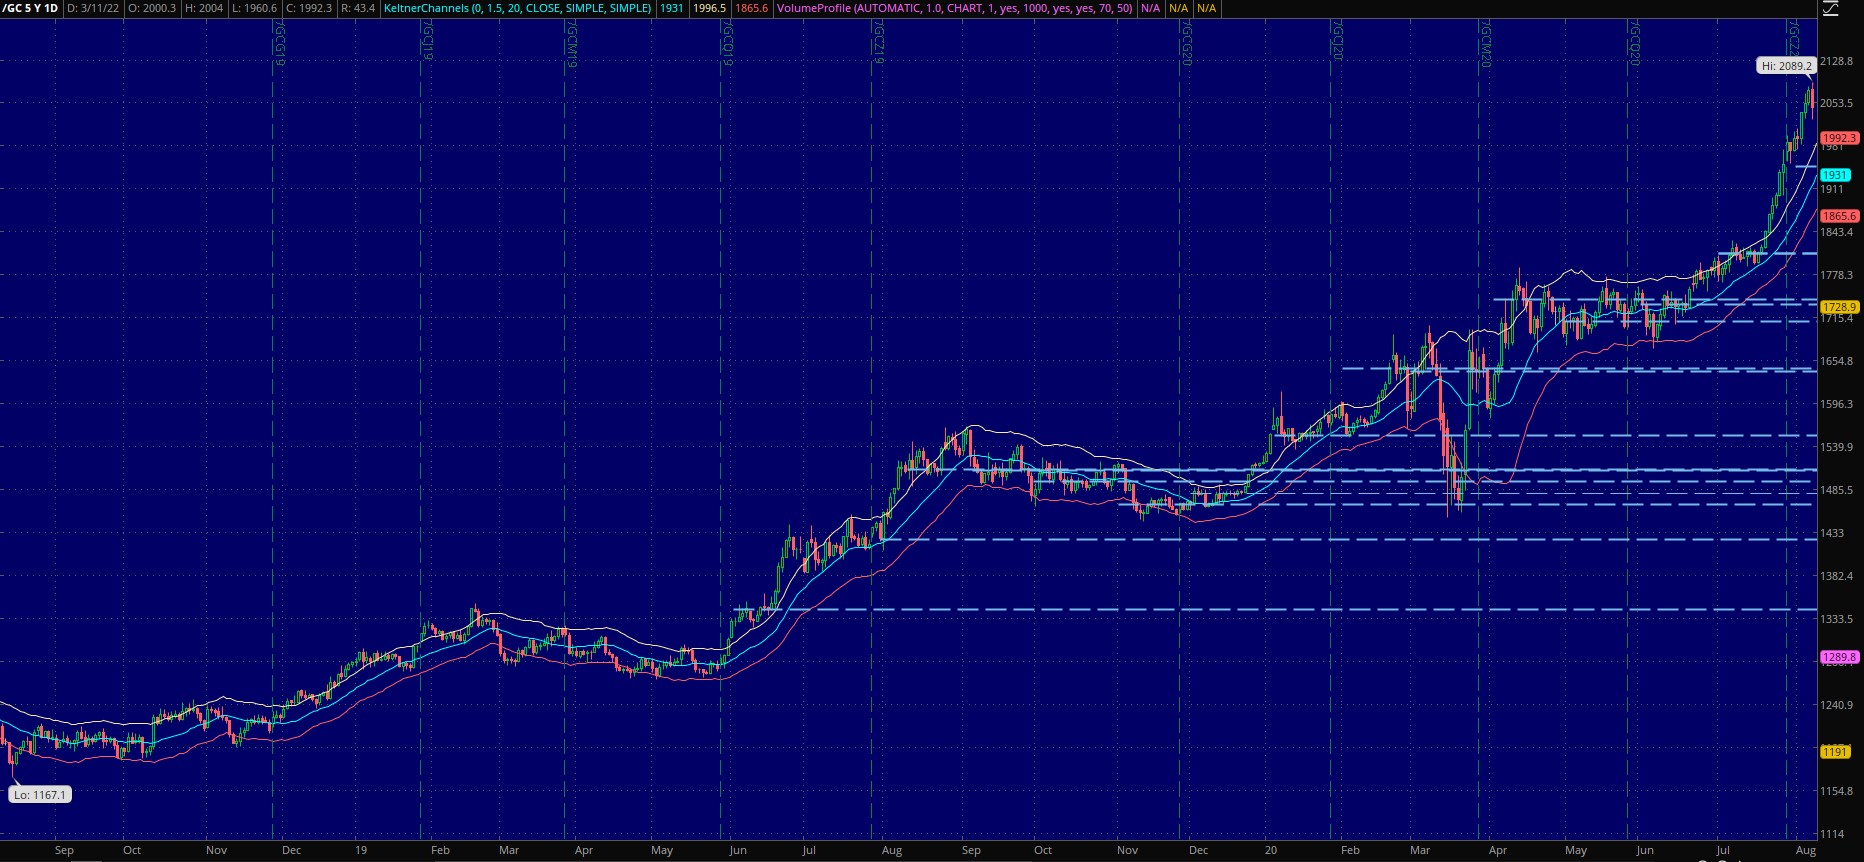
To begin to answer that question, let’s first take a look back at the gold to oil analog. As I have discussed before, the gold to oil analog runs with roughly a 20 month lag. This means that what gold was doing 20 months ago, oil should be echoing now. This analog was discovered by Tom McClellan. So what was gold up to 20 months ago?
Below is a chart of the bull run in gold from August 2018 – August 2020. I will bring out a few points about this chart. First, take note that gold and oil tend to make spike tops and rounded bottoms. The spike top is a visual representation of panic. On the gold chart you can see the slow moving, rounding bottom that the bull run started out of. You can also see the big spike in August of 2020 that concluded that bull run in gold. This is the spike that we are currently living through in oil, twenty months later.
I will point out here that this analog does not offer a tick for tick amount of specificity, either in price or time. Think of it more as a rough guide. I have been watching this analog daily for the past two years, and will testify to that reality. The gold analog did not point to a top in oil until the beginning of April of this year, which is still a couple weeks away. I am willing to accept that those two weeks are within the margin of error of this analog, and was likely pulled forward in time due to the war in Ukraine.
Now that we have the rough guide of the analog in place to give us perspective, let’s take a look at a few trading indicators that helped me make the decision to leave the energy space. First, how did the ending spike in /GC look? It spiked above the top Keltner band on the daily chart, and remained above the top Keltner channel until the spike was done. When /GC broke back under the top Keltner channel, the top was in. The slope coming out of a parabolic move tends to match the slope going into a parabolic move. Are we seeing that in /CL now? Yes.
Another factor I consider when looking to exit positions is the risk/reward balance. Would I put new money to work right now in energy? If you consider where /CL was trading in Nov/Dec of 2021, there was enormous POC support under price, as well as having the future of the analog as wind to our backs. Risk was small in my mind at that time, and the potential reward was enormous. That is not the case now. The price of /CL has doubled in the past few months. It is seeing a parabolic spike higher. Could it continue higher from here? Yes, but the risk of trying to get anything that remains far outweighs any reward of more upside. There are simply better places to put money to work at the moment.
Finally, I was looking at the below chart of XLE. This is the ETF that tracks the major oil companies. Looking at the chart you can see that XLE has nearly quadrupled over the past two years coming off the Covid crash low. One method I use in determining when to exit positions is an intra-month look at monthly standard deviation levels.
This is a measure to tell me when price is getting too far extended. If you look at the top right corner of the chart you can see the levels noted SD1 and SD2. These are the 1st and 2nd standard deviation levels for XLE for the month of March. To make that easy to understand, there is a 68% chance XLE will close the month of March under SD1 and a 95% chance it will close below SD2. Anything above SD1 I consider a great spot to take profits. Above SD2 I consider it “get out now” territory. We approached SD1 on Monday of last week, and broke through it on Tuesday. I was happy with my profits, and got out.

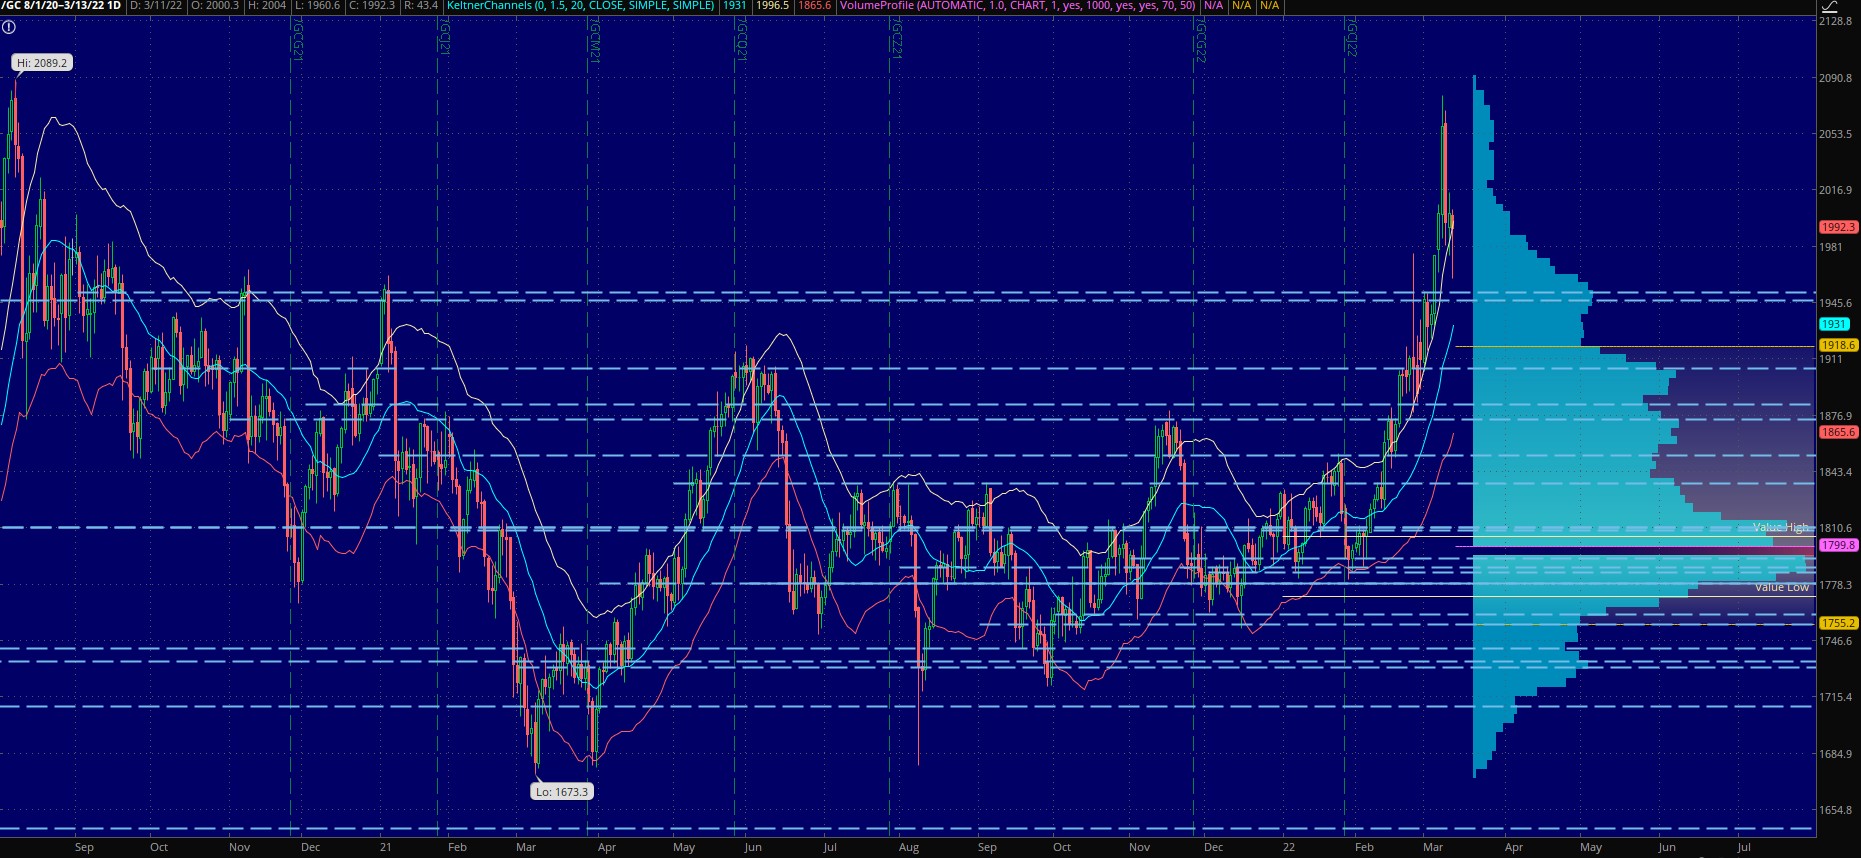
So what’s next for oil? My answer to that question will be to repeat the above process. First, let’s take a look at what gold has been doing since its top in August of 2020. This should give us a good big picture look at what to expect with oil moving forward. What followed was a nasty seven month pullback, seven more months of sideways consolidation, before gold started back higher in earnest. I expect something similar for oil. I think oil is topping out here, and will likely be in a downtrend until the mid-term elections this fall. After the elections, oil will likely begin moving higher aggressively again.
Another analog that gold is useful for is its relationship to interest rates, specifically U.S. Treasury bonds. Where oil works off a 20 month lag time, interest rates work off a slightly longer 20.5 month time lag. This can be especially useful in our current environment where we just witnessed a large spike in oil. Over the next 2-3 weeks I’m expecting a similar spike higher in interest rates. Thus, as I took my energy profits last week, I moved some of that money over to attempt to profit from a spike in interest rates. I did this via buying May TLT puts.
The below chart is a five year chart of /ZN, which tracks the 10 U.S. Treasury bond. Keep in mind that bond prices move inversely to bond yields. So, as this chart falls, the yield rises. I am expecting a big spike in yields, so I’m therefore expecting this chart to fall hard.
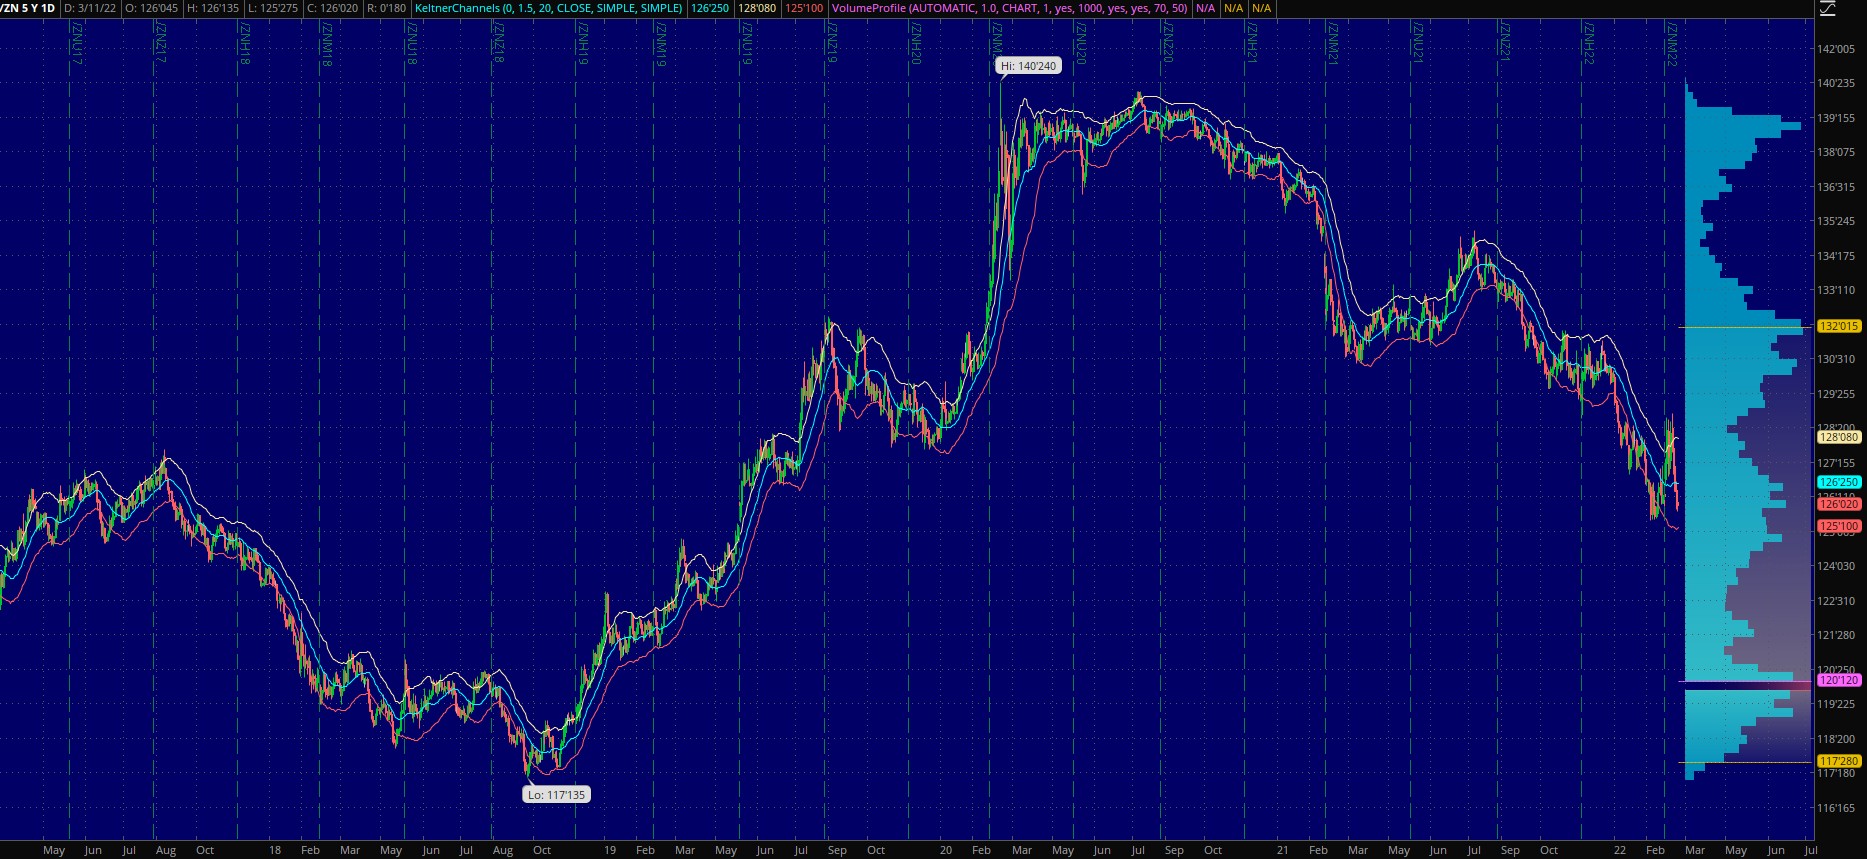
A couple things of note on the /ZN chart. First, it has been following nicely the /GC to /ZN analog with a roughly 20.5 month lag. /ZN had a small bear market rally to begin the month of March, but fell hard last week as you can see. A break of the most recent lows will likely take /ZN back to lows of this chart by early April. I am positioned for that outcome.
Finally, I want to take a look at the S&P 500. Below is a three year chart of /ES, which tracks the S&P 500. On the chart you see the large drop from the Covid crash, the huge QE-fueled rally that followed, and what appears to be an important top that we’ve been working to put in for the past 7-8 months.
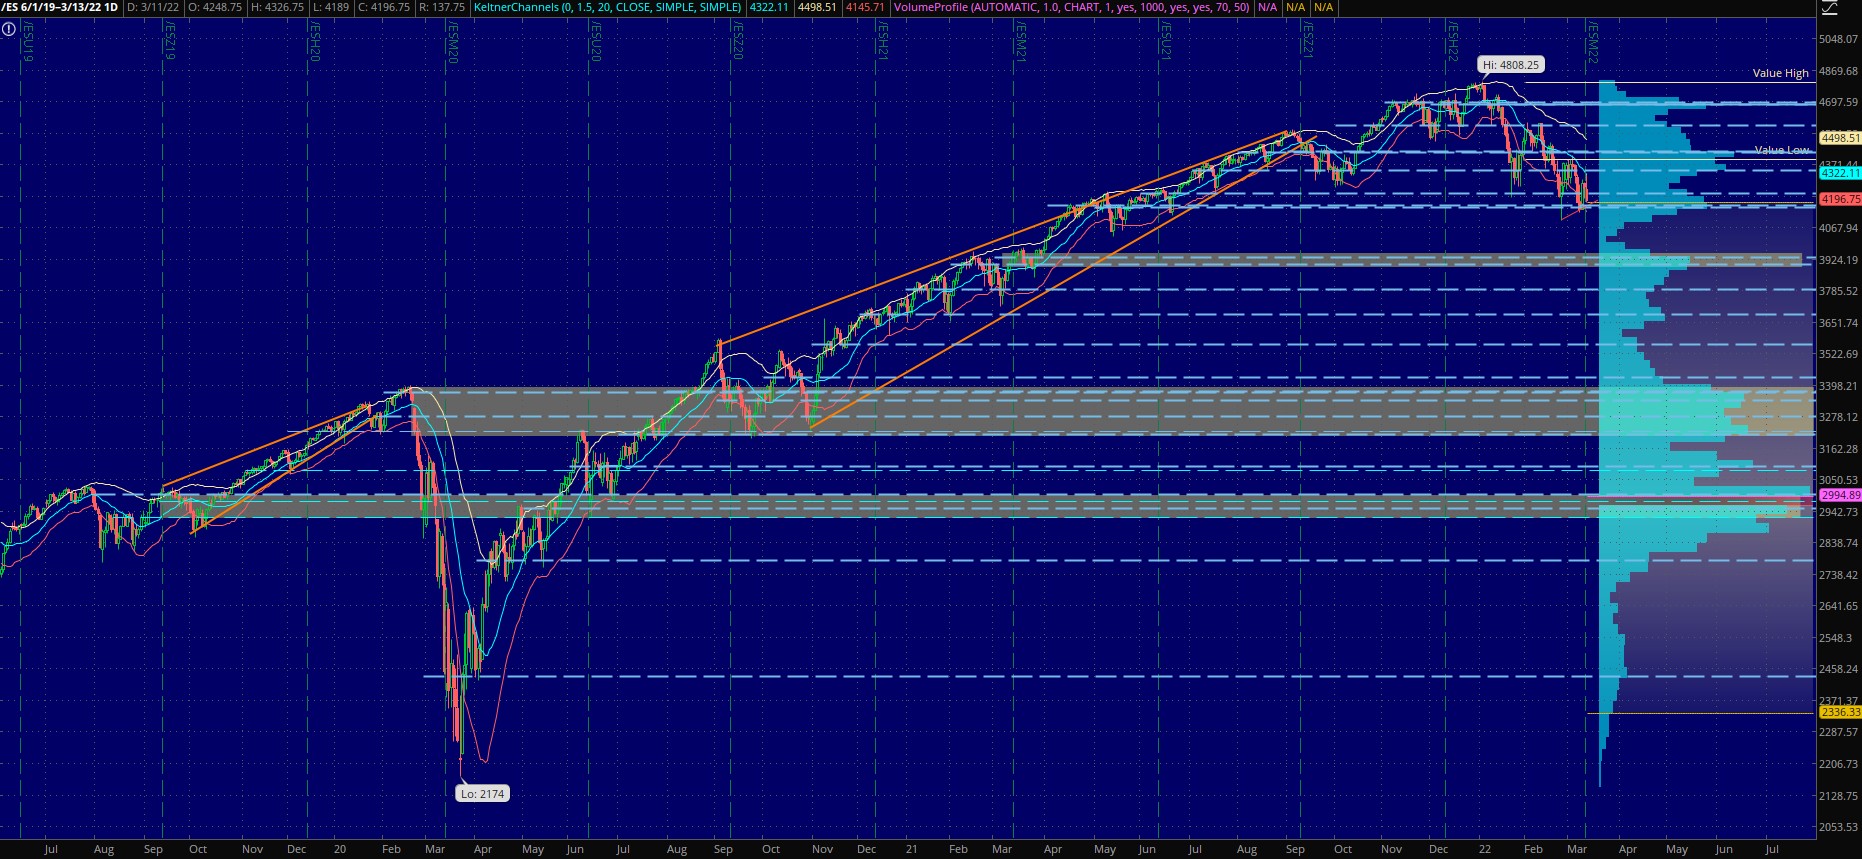
I want to bring your attention first the numerous horizontal, dashed lines that I have on the chart. These are what I call monthly POCs. They show what price level had the most trading volume for each month. These can serve as important areas of possible support/resistance. They are especially important when they are clustered together.
You will need to subscribe to his service for the analysis, but I will tell you that Mr. McClellan is looking for important price bottoms in /ES near the beginning of April, and also the beginning of June. The bottom in early June should be one to go up out of. So where is /ES heading until early June?
What immediately strikes me is the current setup in /ES. It’s showing a nasty, downward slanting head and shoulders top, which is set to execute if it continues lower from current levels. /ES is currently sitting on a ledge of a cluster of two POCs between 4161-4174. Below that level we’ve got an air pocket down to the next POC cluster around 3925. I think it is likely we close that air gap rapidly.
Looking at the other POCs on the /ES chart, I see a lot of single lines. This tell me there was no consolidation in the QE rally, and the market can move rapidly downward through those areas if it chooses. I have highlighted two clusters of POCs that will likely offer support, if the market gets more aggressive to the downside.
To wrap things up:
- I think the oil top is in. Once that becomes more clear, I will look for a good entry to short oil and oil companies into the fall of this year.
- I think interest rates are about to spike up hard into early April. I am positioned for that via TLT puts. After the interest rate spike is done, I will look to short rates into the fall, likely via TLT calls.
- I think the S&P 500 will remain in a downtrend until June. After early June, it will likely trend higher for the remainder of 2022. I currently own SPY and IYR puts.
