
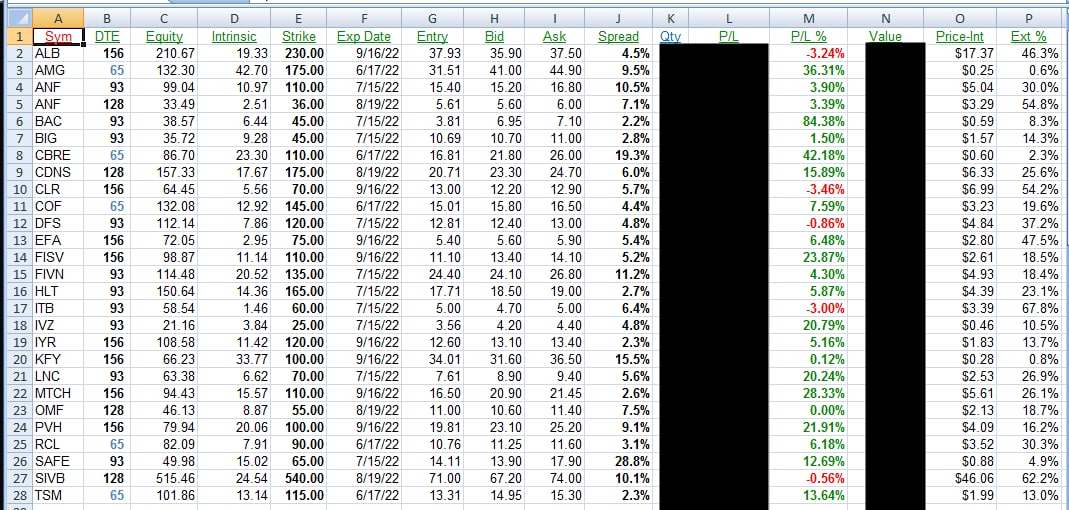
It’s a pretty “blah” day so far, and I strongly suspect will end as such, so I thought I’d spend the time sharing something I rarely share, which is my positions spreadsheet. It’ll give me something to talk about (click for a more readable version):
Let me explain each of the columns of the spreadsheet, from left to right. To be clear, these are all very simple options positions. I simply am long puts, betting on a drop in the stock price and thus a meaningful percentage gain in the value of the put option.
- Sym: the underling symbol;
- DTE: the number of calendar days until the options expirations; (I tend to be extremely conservative and buy options with three or more months on them);
- Equity: the most recent price of the underlying equity;
- Intrinsic: the intrinsic value of the option; (again, I tend to be conservative and get in-the-money, sometimes deeply so, strikes)
- Strike: the strike price;
- Exp Date: the option’s expiration date;
- Entry: the price I paid for the contract;
- Bid: the latest bid price for the contract;
- Ask: the latest ask price for the contract;
- Spread: the percentage distance between the bid and the ask; (in a few instances, this is obscenely large, because the options market absolutely stinks for some items)
- Qty: I’ve hidden this for reasons of privacy, but this is the number of contracts;
- P/L: hidden for privacy, but this is the nominal dollar profit or loss;
- P/L %: this is the percentage gain or loss on the position;
- Price-Int: this is the extrinsic value of the option;
- Ext %: this is the extrinsic value in percentage terms (the closer this is to 0, the more “pure” it is with respect to its intrinsic value)
When the day began, this spreadsheet was a beautiful sea of green – – everything profitable! With the (inexplicable) zip higher in equities, there are some pock marks here and there. I use this spreadsheet constantly, since being able to sort based on any of these columns is invaluable.
What I tend to worry about the most is time-to-expiration, because I like gobs and gobs of time in front of me for the market to sort out its silliness. I thus went ahead and closed out a few of my nearest-term positions (which is still a hearty two-plus months away!) and am at 20% cash at the moment.
Anyway, some folks are curious not just about the symbols I’m in but the very specific contracts, so there you have it. I figure there might be some value for some of you out there to see the particulars of the spreadsheet itself.
