I seem to be locked in to getting up at 4 in the morning now, so might as well do a post. Let’s talk about this chart of the recent activity on the S&P 500 futures:
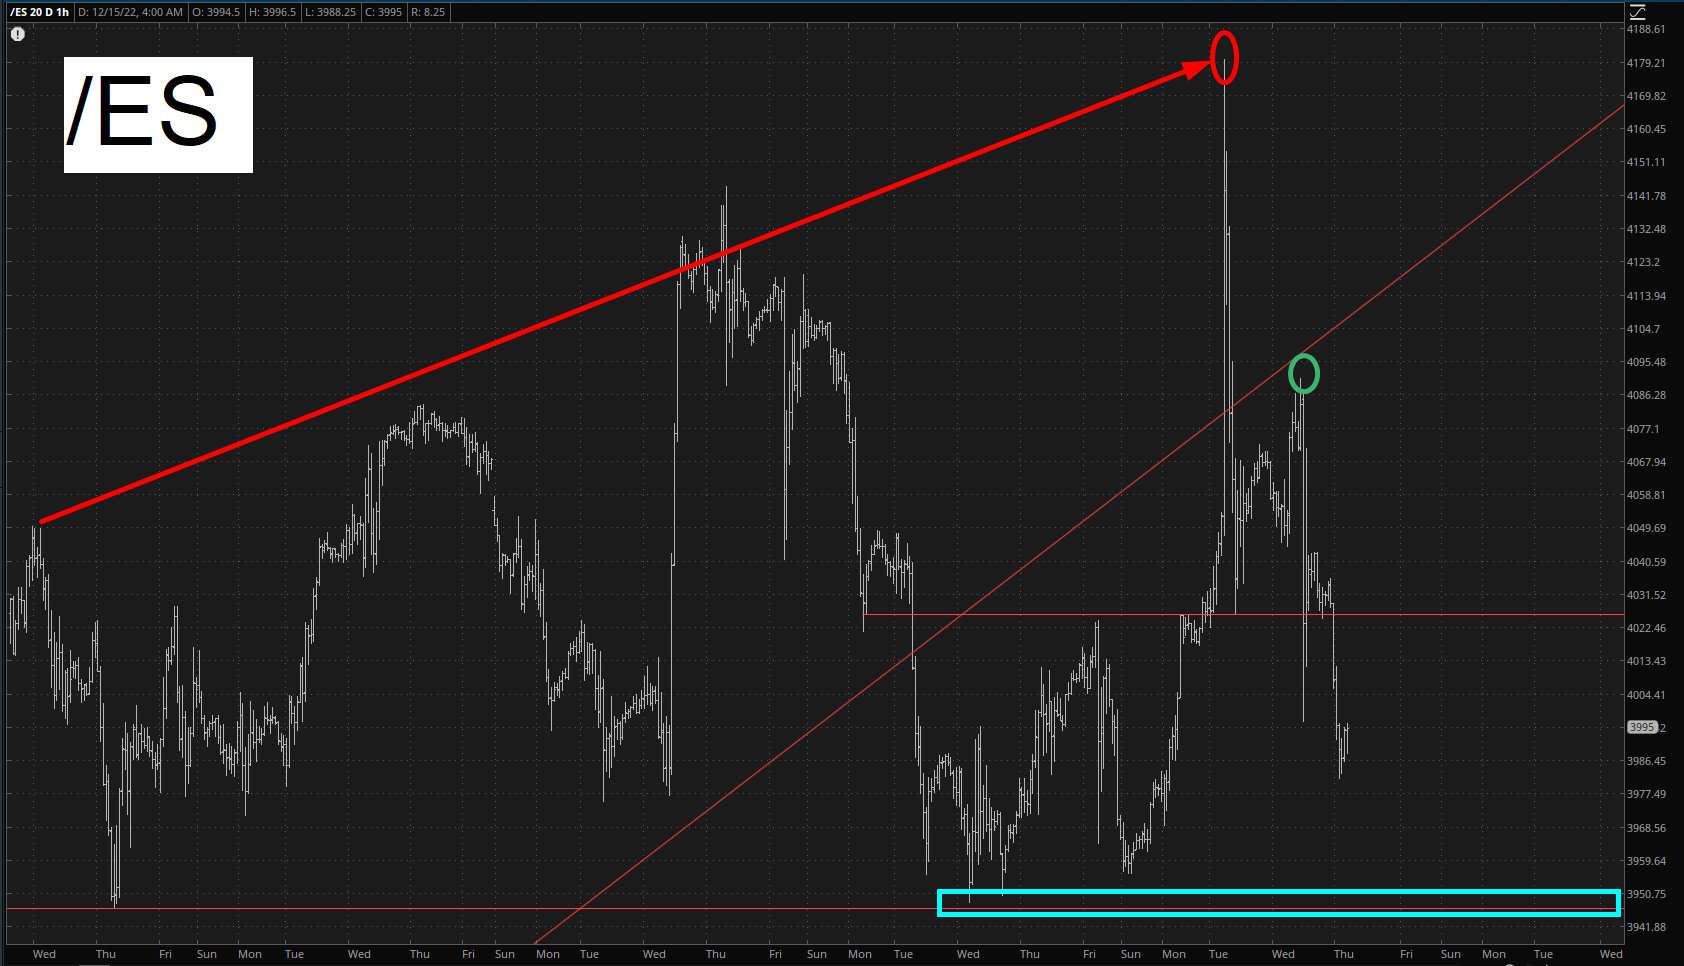
I’ve marked it as follows:
- The red trendline is, in my opinion, the last gasp of the bull-gasm that started on October 13th, and we are now finally poised for some serious weakness;
- The red circle is the high water mark following the release of the CPI. It was pegged within milliseconds of the release of the data;
- The green circle is the high water mark for the “oh boy oh boy the FOMC announcement is going to be great” anticipation; the irony is that the bulls were handed EVERYTHING they wanted on a silver platter, and yet the market is still falling;
- What needs to happen next is to take out the level in teal, around 3940, to get panic setting in again
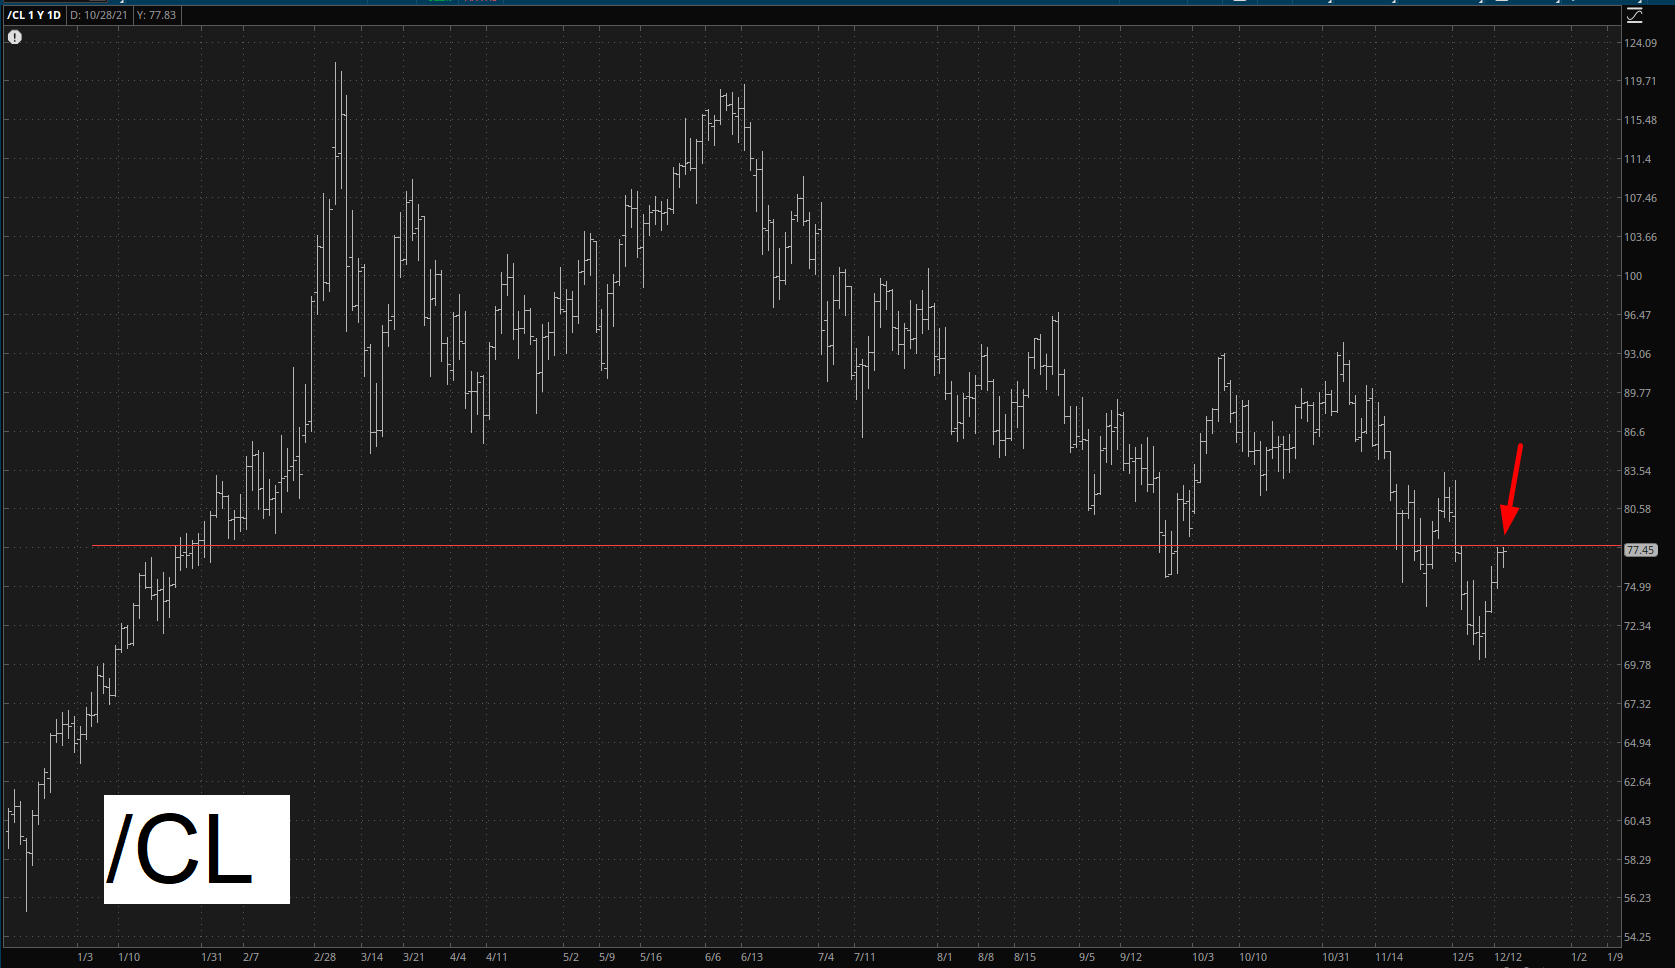
Next up is crude oil, which to me is important since I have such a concentration of energy shorts. My view here is that we’ve got a fantastic, and massive, blob of overhead supply that spans about eight full months.
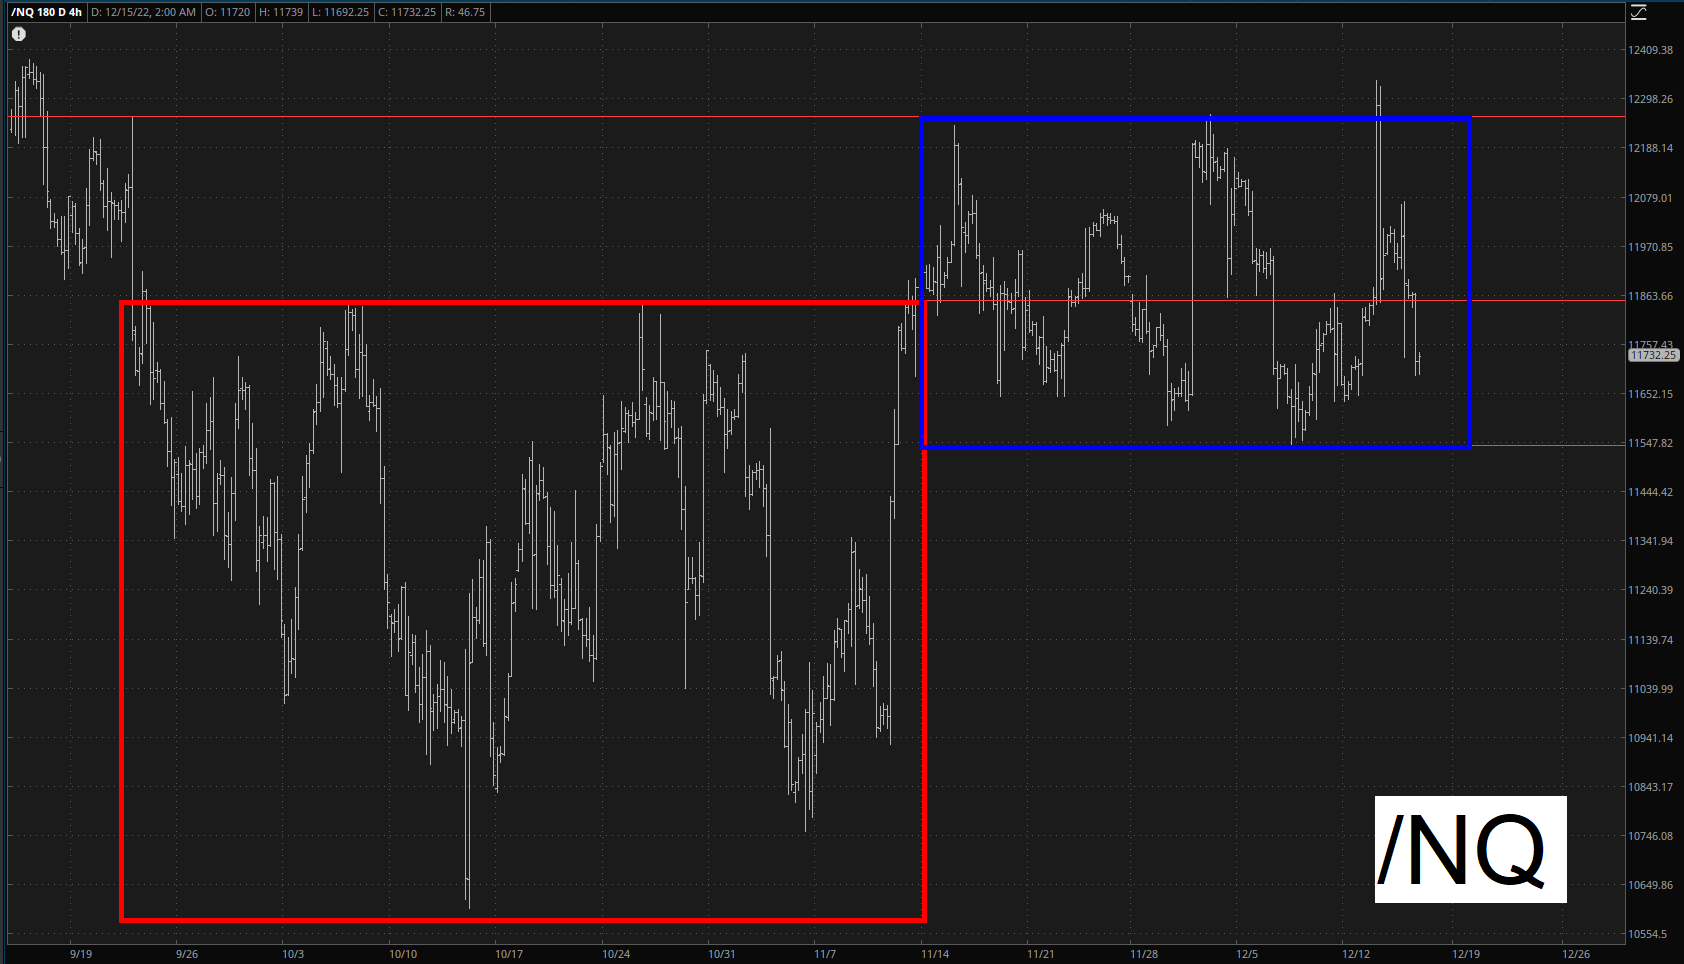
Back to equities, the NASDAQ has clearly failed to reach escaped velocity from its bullish base (in red) and has instead been struggling in a range-bound pattern which is centered on the aforementioned pattern’s neckline. What I’d love to see here, of course, is for the oscillation to tumble below the blue box, thus invalidating the bullish setup even worse than it already has been.
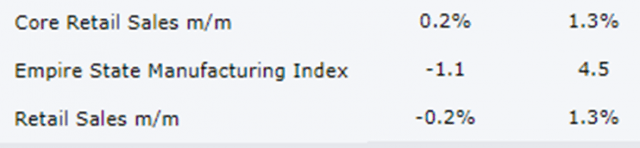
I am publishing this post a full half hour before a trio of important economic data comes out, so who knows how they’ll stir the pot, but at this point in time, the screen is gloriously red. I’ll see you after the cash market is open.