
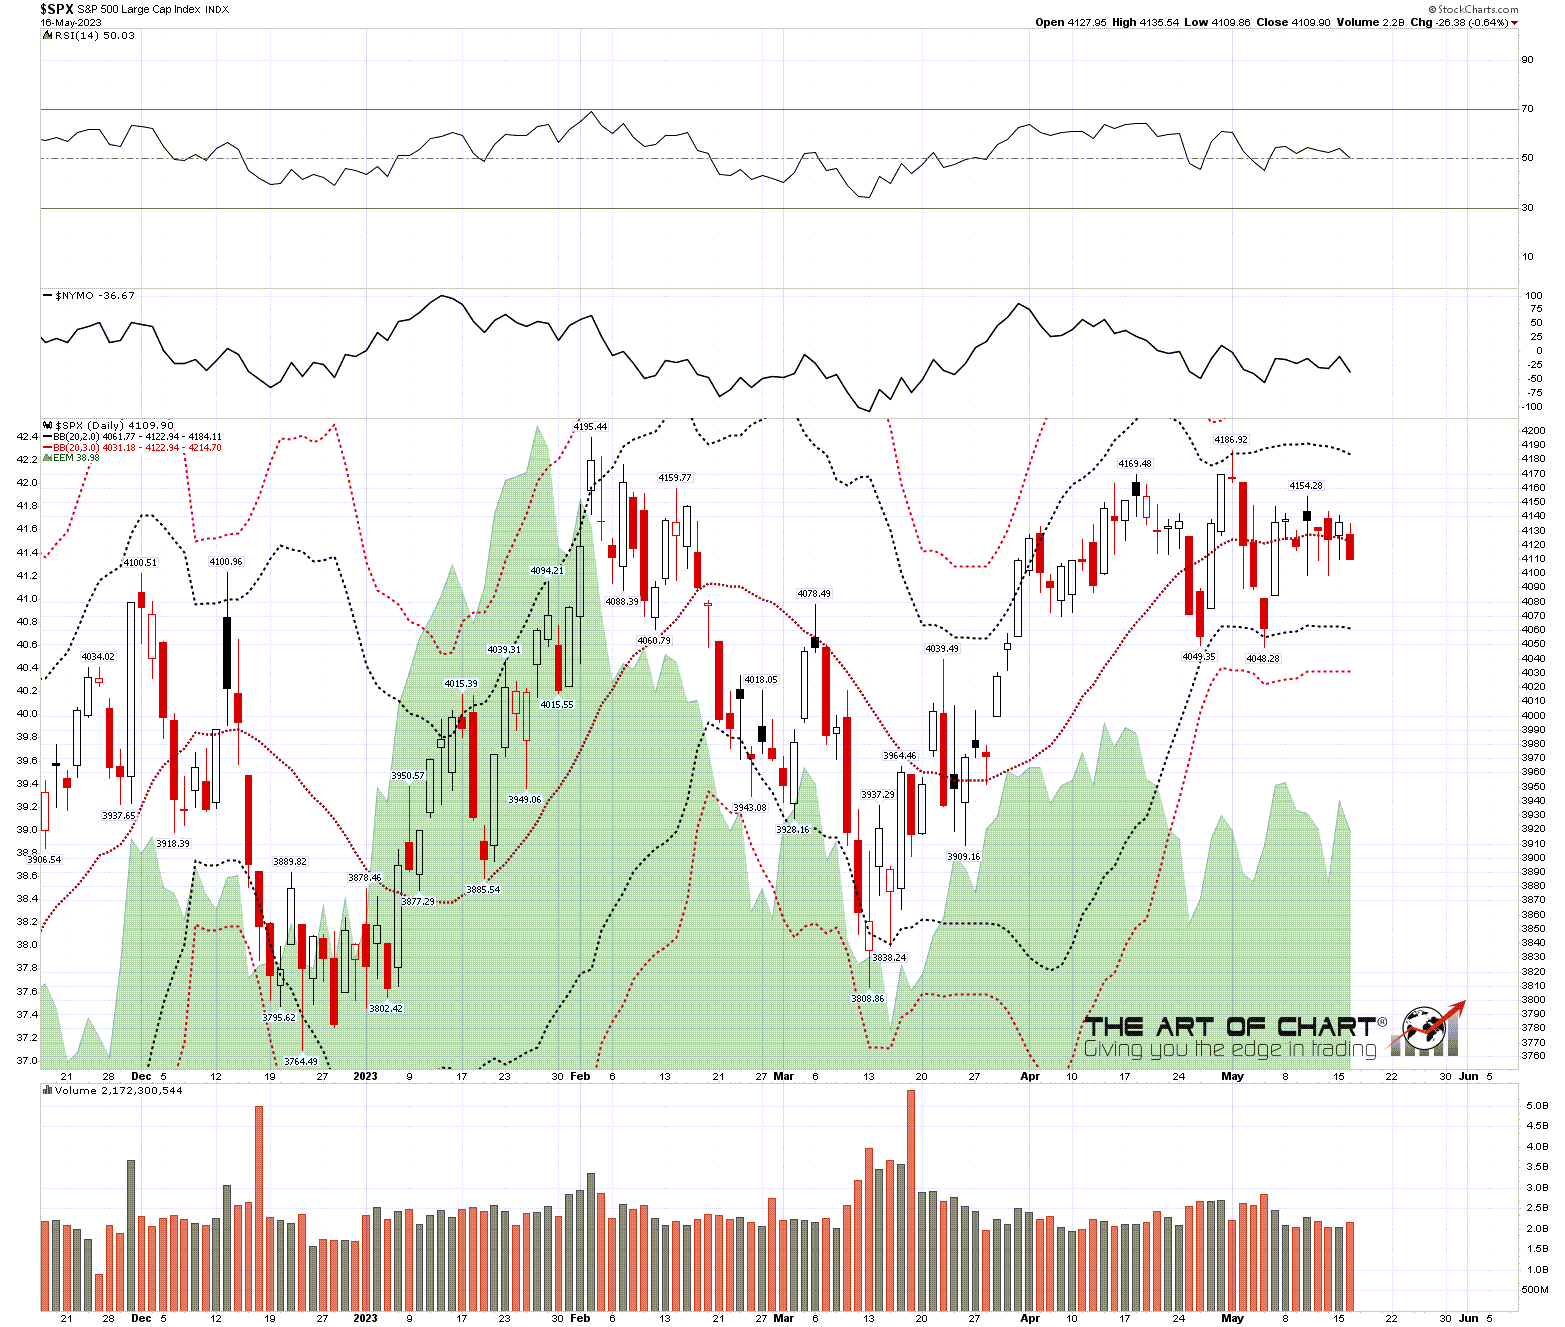
SPX has been trading in a range and moving back and forth through the daily middle band, with strong established support in the 4100 area, but unable to convert it to convincing support or resistance.
SPX daily BBs chart:
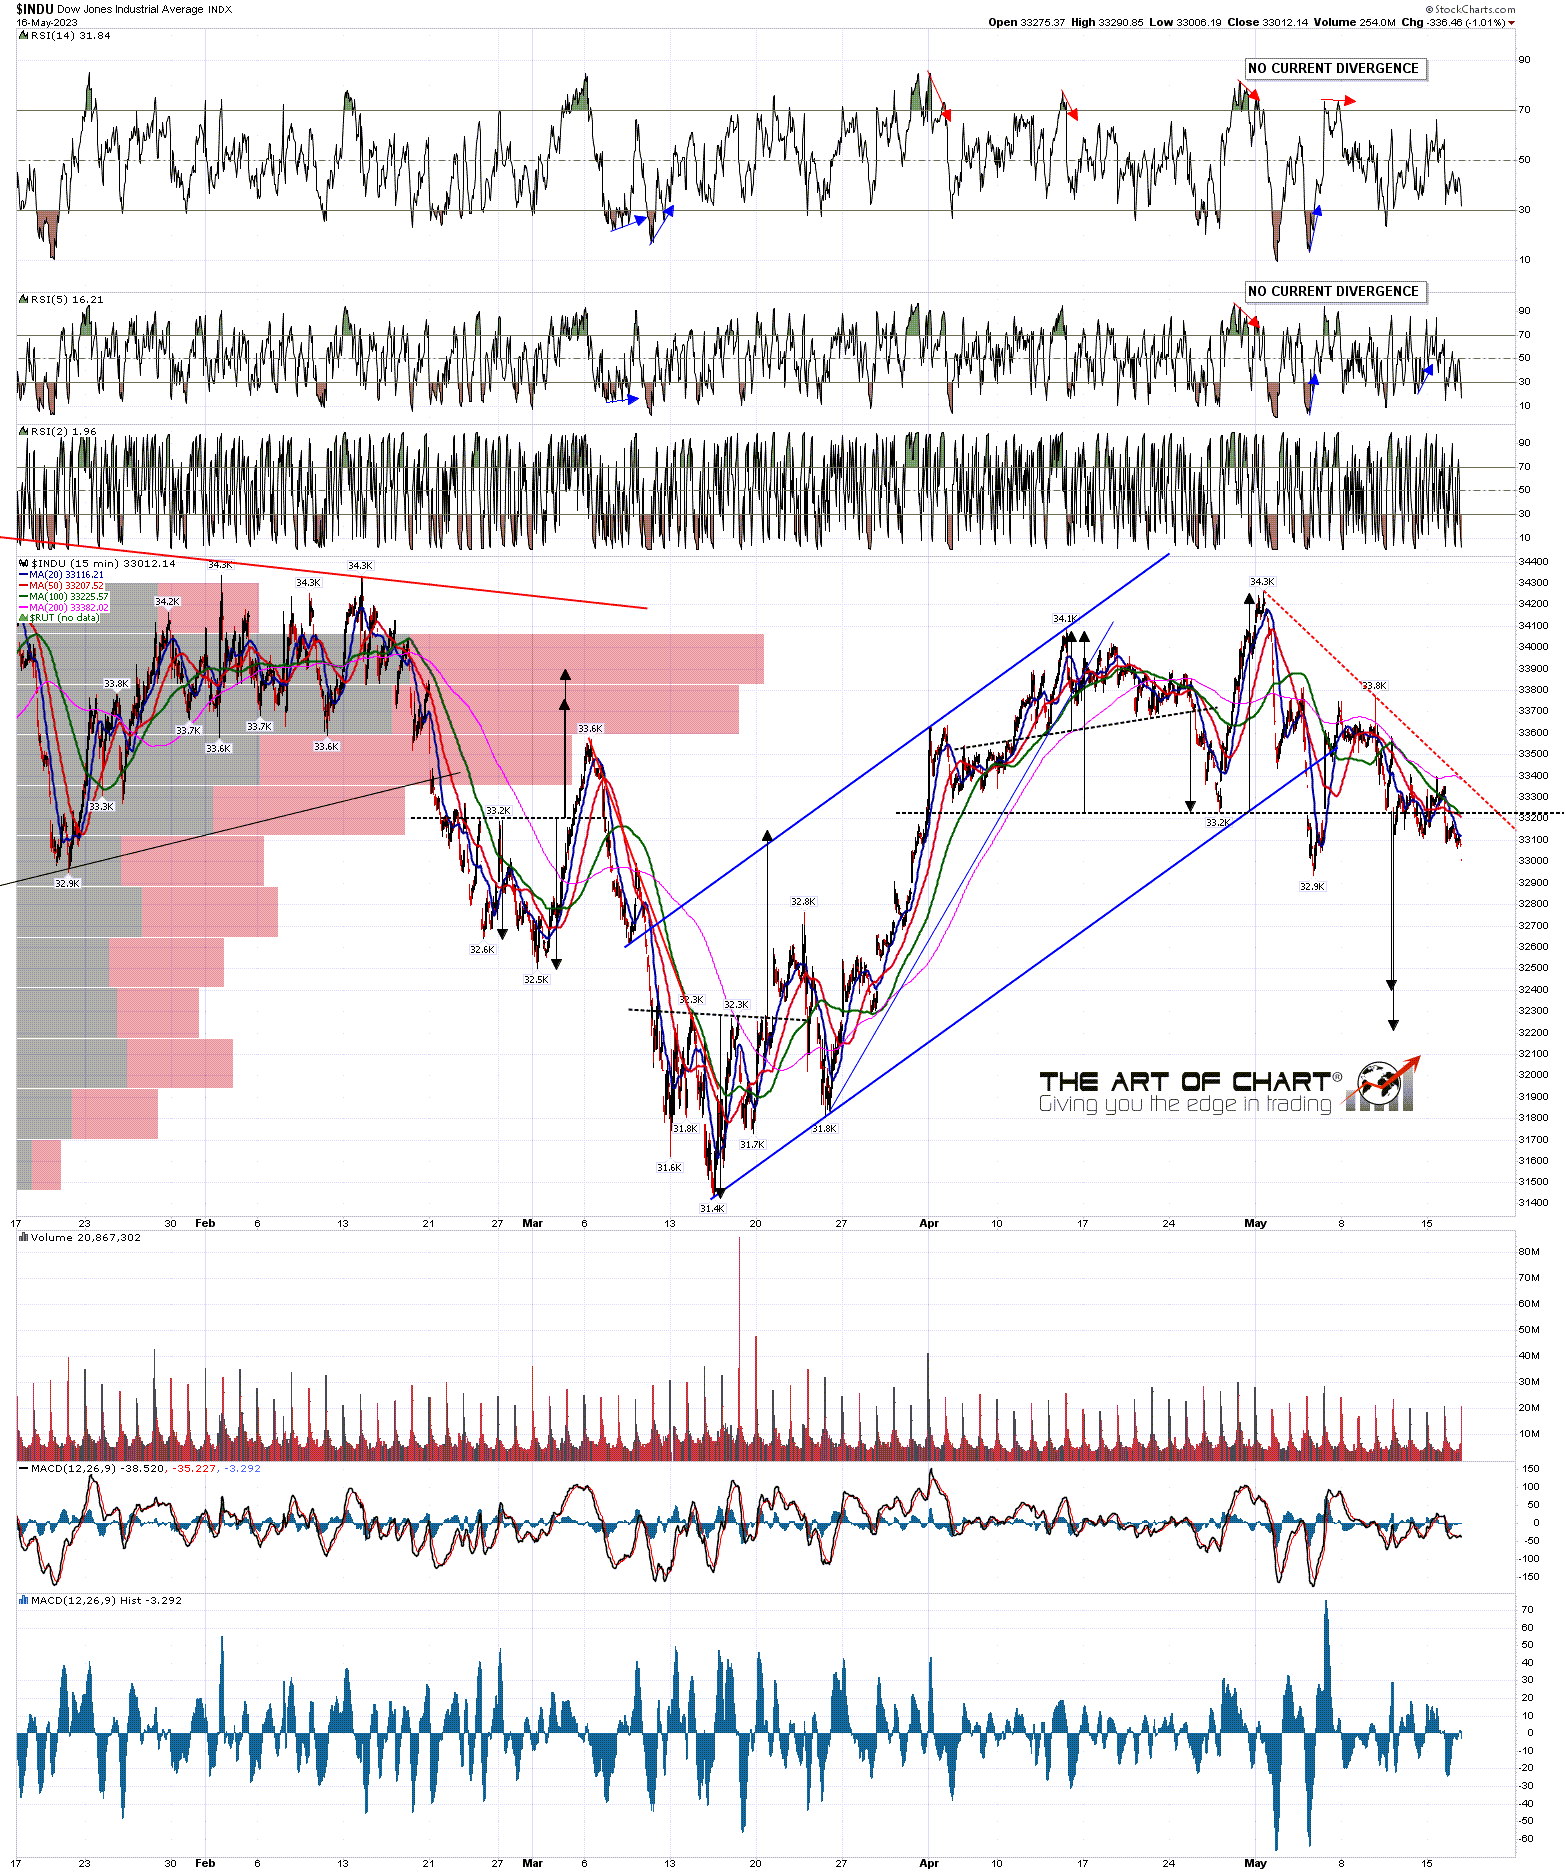
NDX has led this rally, and already surpassed the previous highs. SPX has been trading a range around the daily middle band, IWM has been weaker, and Dow is close to breaching the May lows.
INDU 15min chart:
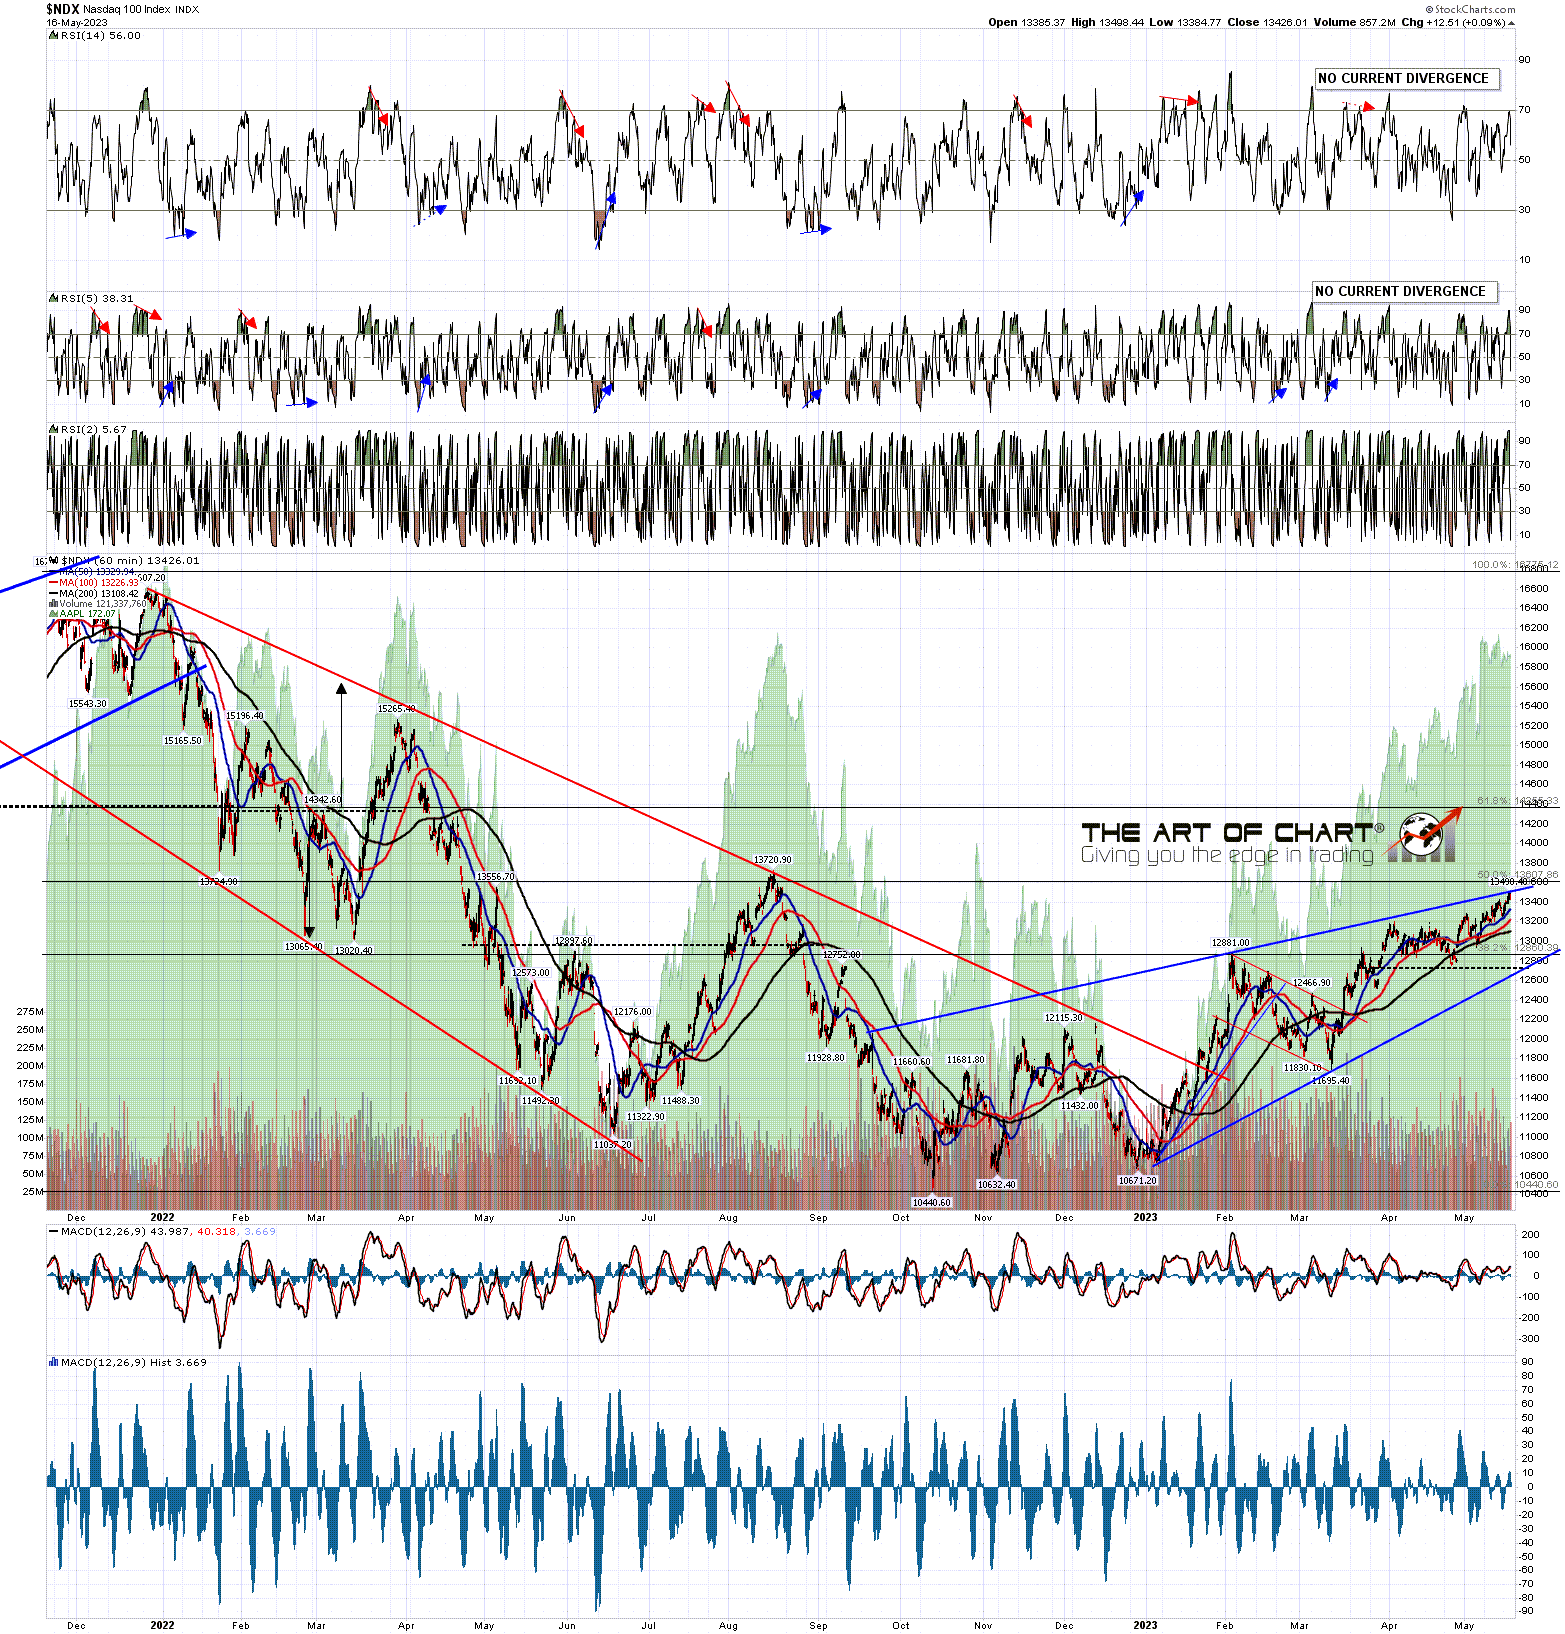
So with NDX leading to the upside here, how is that looking?
On the hourly chart the high yesterday has established a three touch trendline on a high quality rising wedge. That might still overthrow into a full retest of the August high at 13720.90 of course, but the setup looks promising for a reversal either here, or soon.
I would note though that a sustained break up from here, as these break up about 30% of the time, this might turn out to be a bottoming pattern setting up a retest of the all time high.
NDX 60min chart:
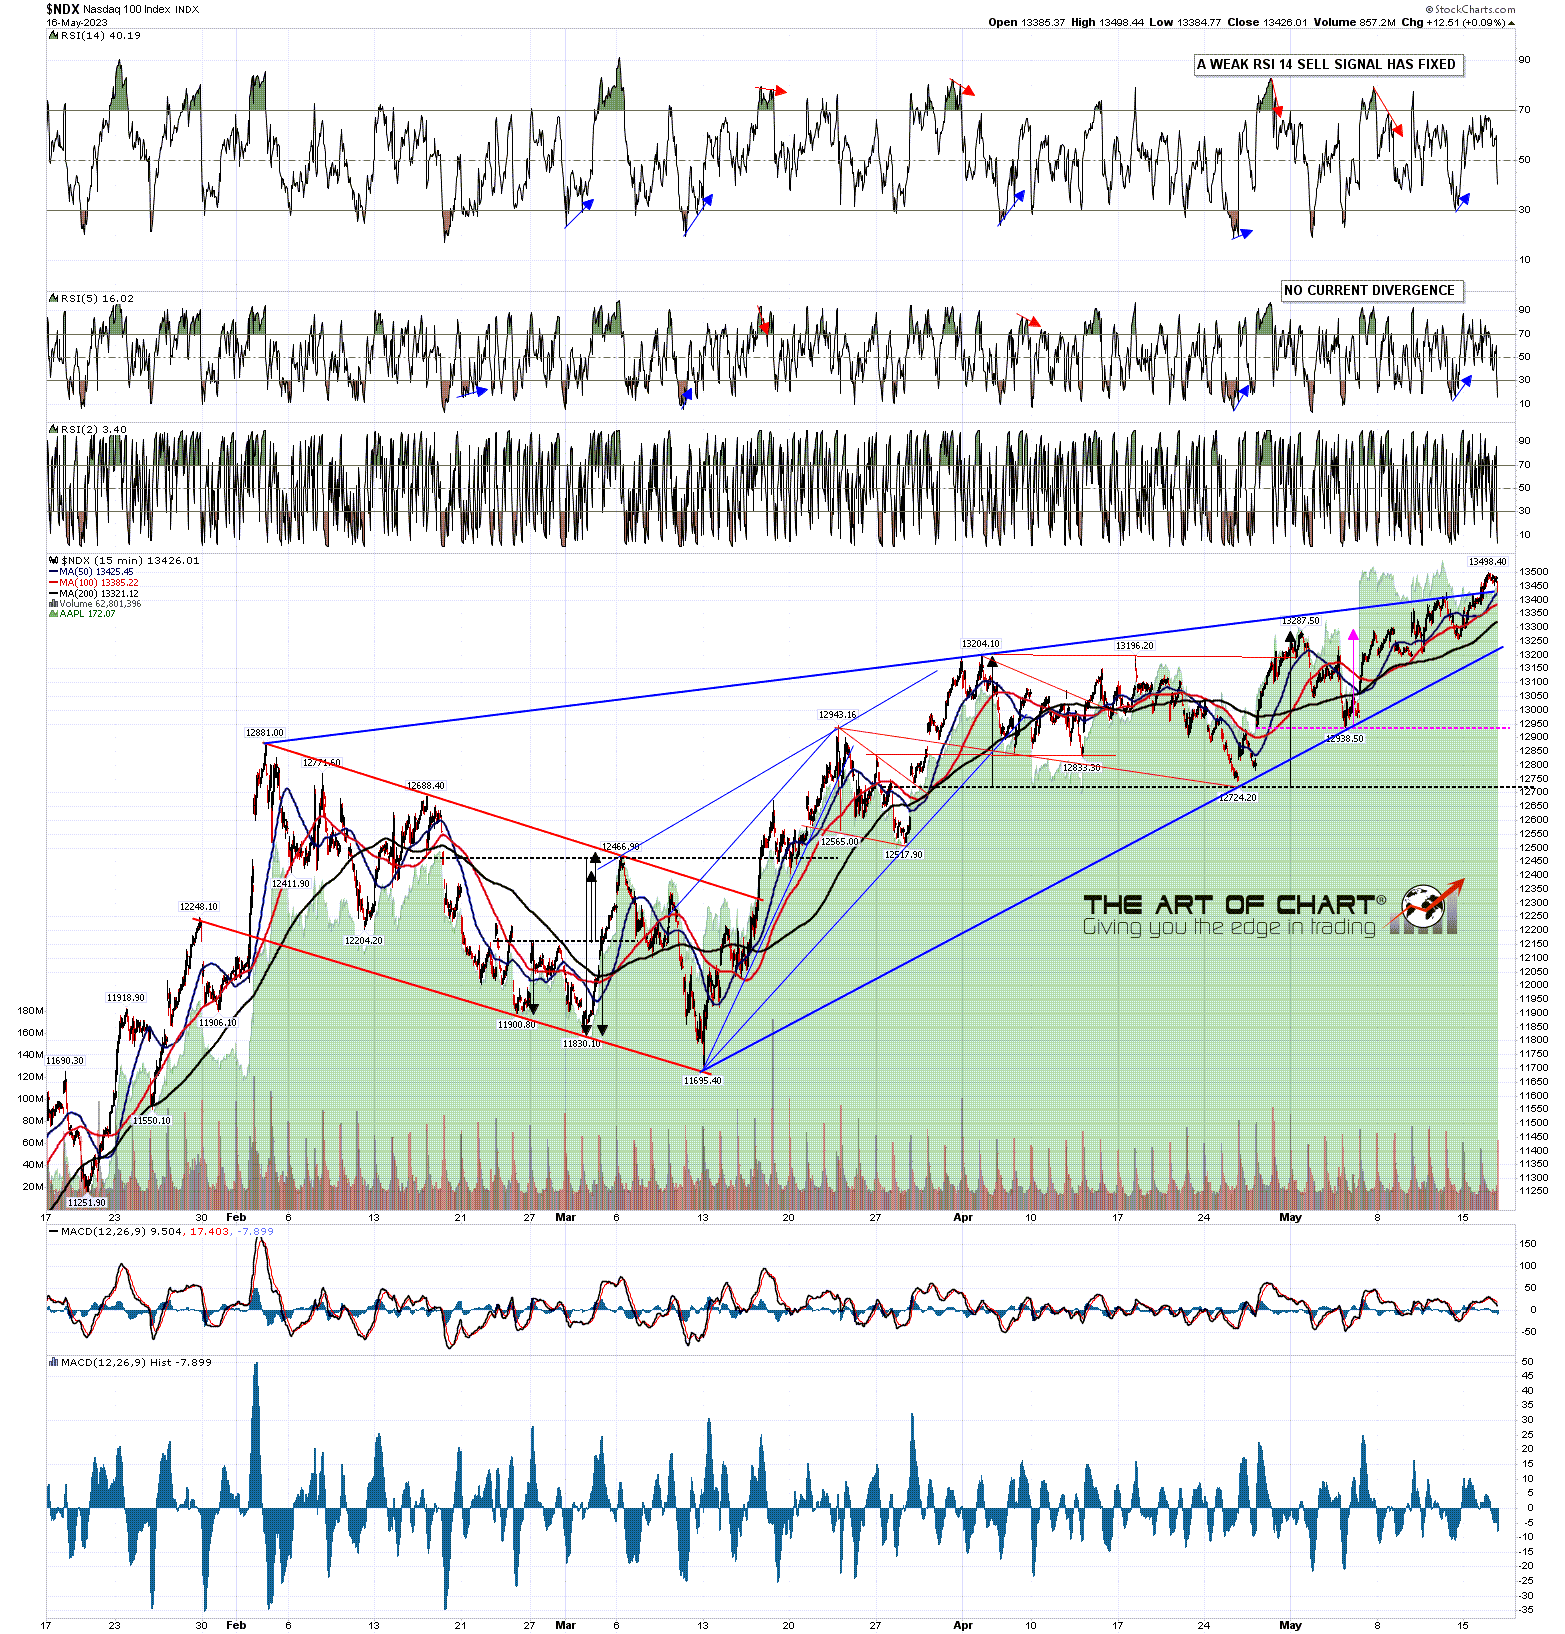
In the shorter term there is also a decent looking rising wedge from the March low that has now overthrown slightly.
NDX 15min chart:
If equities are going to break back down this week then the obvious day to do that would be today or tomorrow, which historically lean 62% bearish, and on SPX a sustained break back below established support at 4100 would look for a retest of the May lows at 4048/9. We’ve been having an assortment of Fed speakers this week and I think there are still more to come.
On the bigger picture I still think that the odds are 75%+ that SPX has topped out or is topping out short term for at least a decent retracement, and we still have topping patterns breaking down. Is there a chance that SPX will break up over resistance here instead of failing? Always, every good setup can always fail and go the other way, and I have assigned a probability of 25% to that, though in practical terms I think the odds of that would be more like 15% to 20%, rising back to 25% if we see a retest of the May high.
I set up a modestly sized model trade for the next few months and am following it here. I entered that with 9x MES (micro-ES) just before the close on Friday 28th April at 4190. 10x MES is equivalent to 1x ES, so this isn’t a large trade, but I’m planning to trade around it on the way down.
The entry was at 4190, the target is at 3430, 760 handles below. The stop for the trade was 70 handles above at 4260 (at which point SPX would likely be breaking up), so the risk/reward ratio is slightly over 1:10, though if the trade needs to be rolled that will likely reduce a bit below that. As the initial double top has now broken down I have moved the stop to even at 4190. If that is stopped out I would likely re-enter at a retest of the May high. Max risk on the trade was $3,150, and if taken off at target without the need to roll the trade will yield $34,200. I will consider taking a third off near the 3940 and 3690 areas if seen, and perhaps adding them back on after any subsequent rallies. We’ll see how that goes, but at the time of writing this trade is currently up about 60 handles.
If you are enjoying my analysis and would like to see it every day at theartofchart.net, which I co-founded in 2015, you can register for a 30 day free trial here. It is included in the Daily Video Service, which in turn is included in the Triple Play Service.
