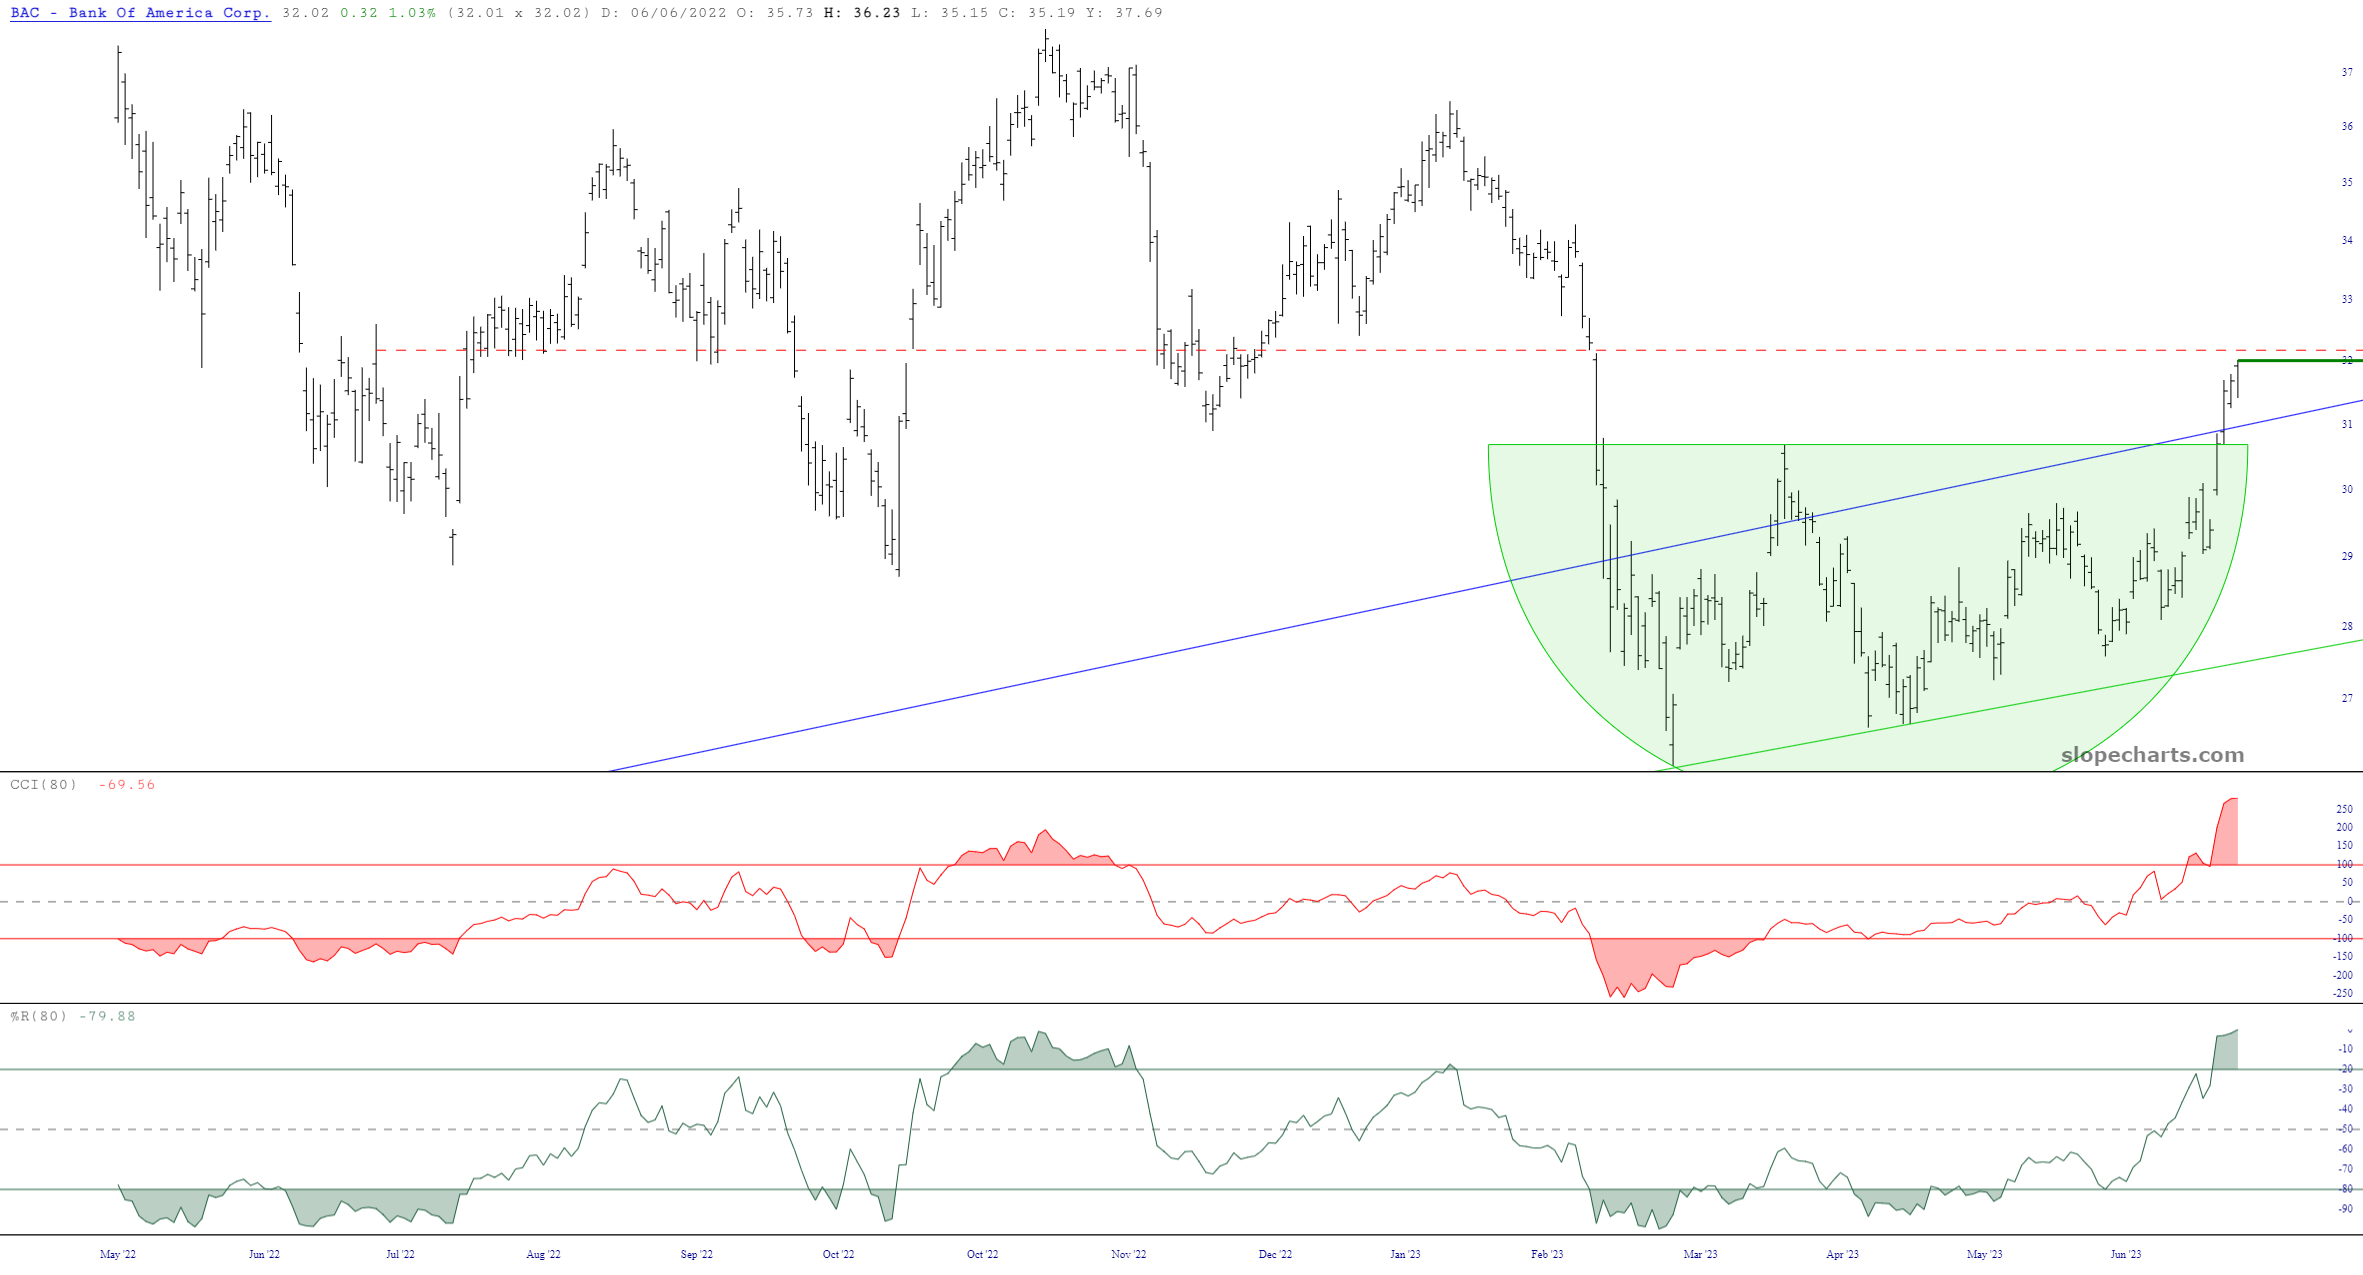
In my newly-lean portfolio of a mere 8 positions (2 ETFs, 6 stocks, all based on long puts) one of the newer ones is Bank of America (BAC). I don’t tend to use indicators in my analysis, but in this instance, I’ve provided some interesting selections with BAC in the captions below:
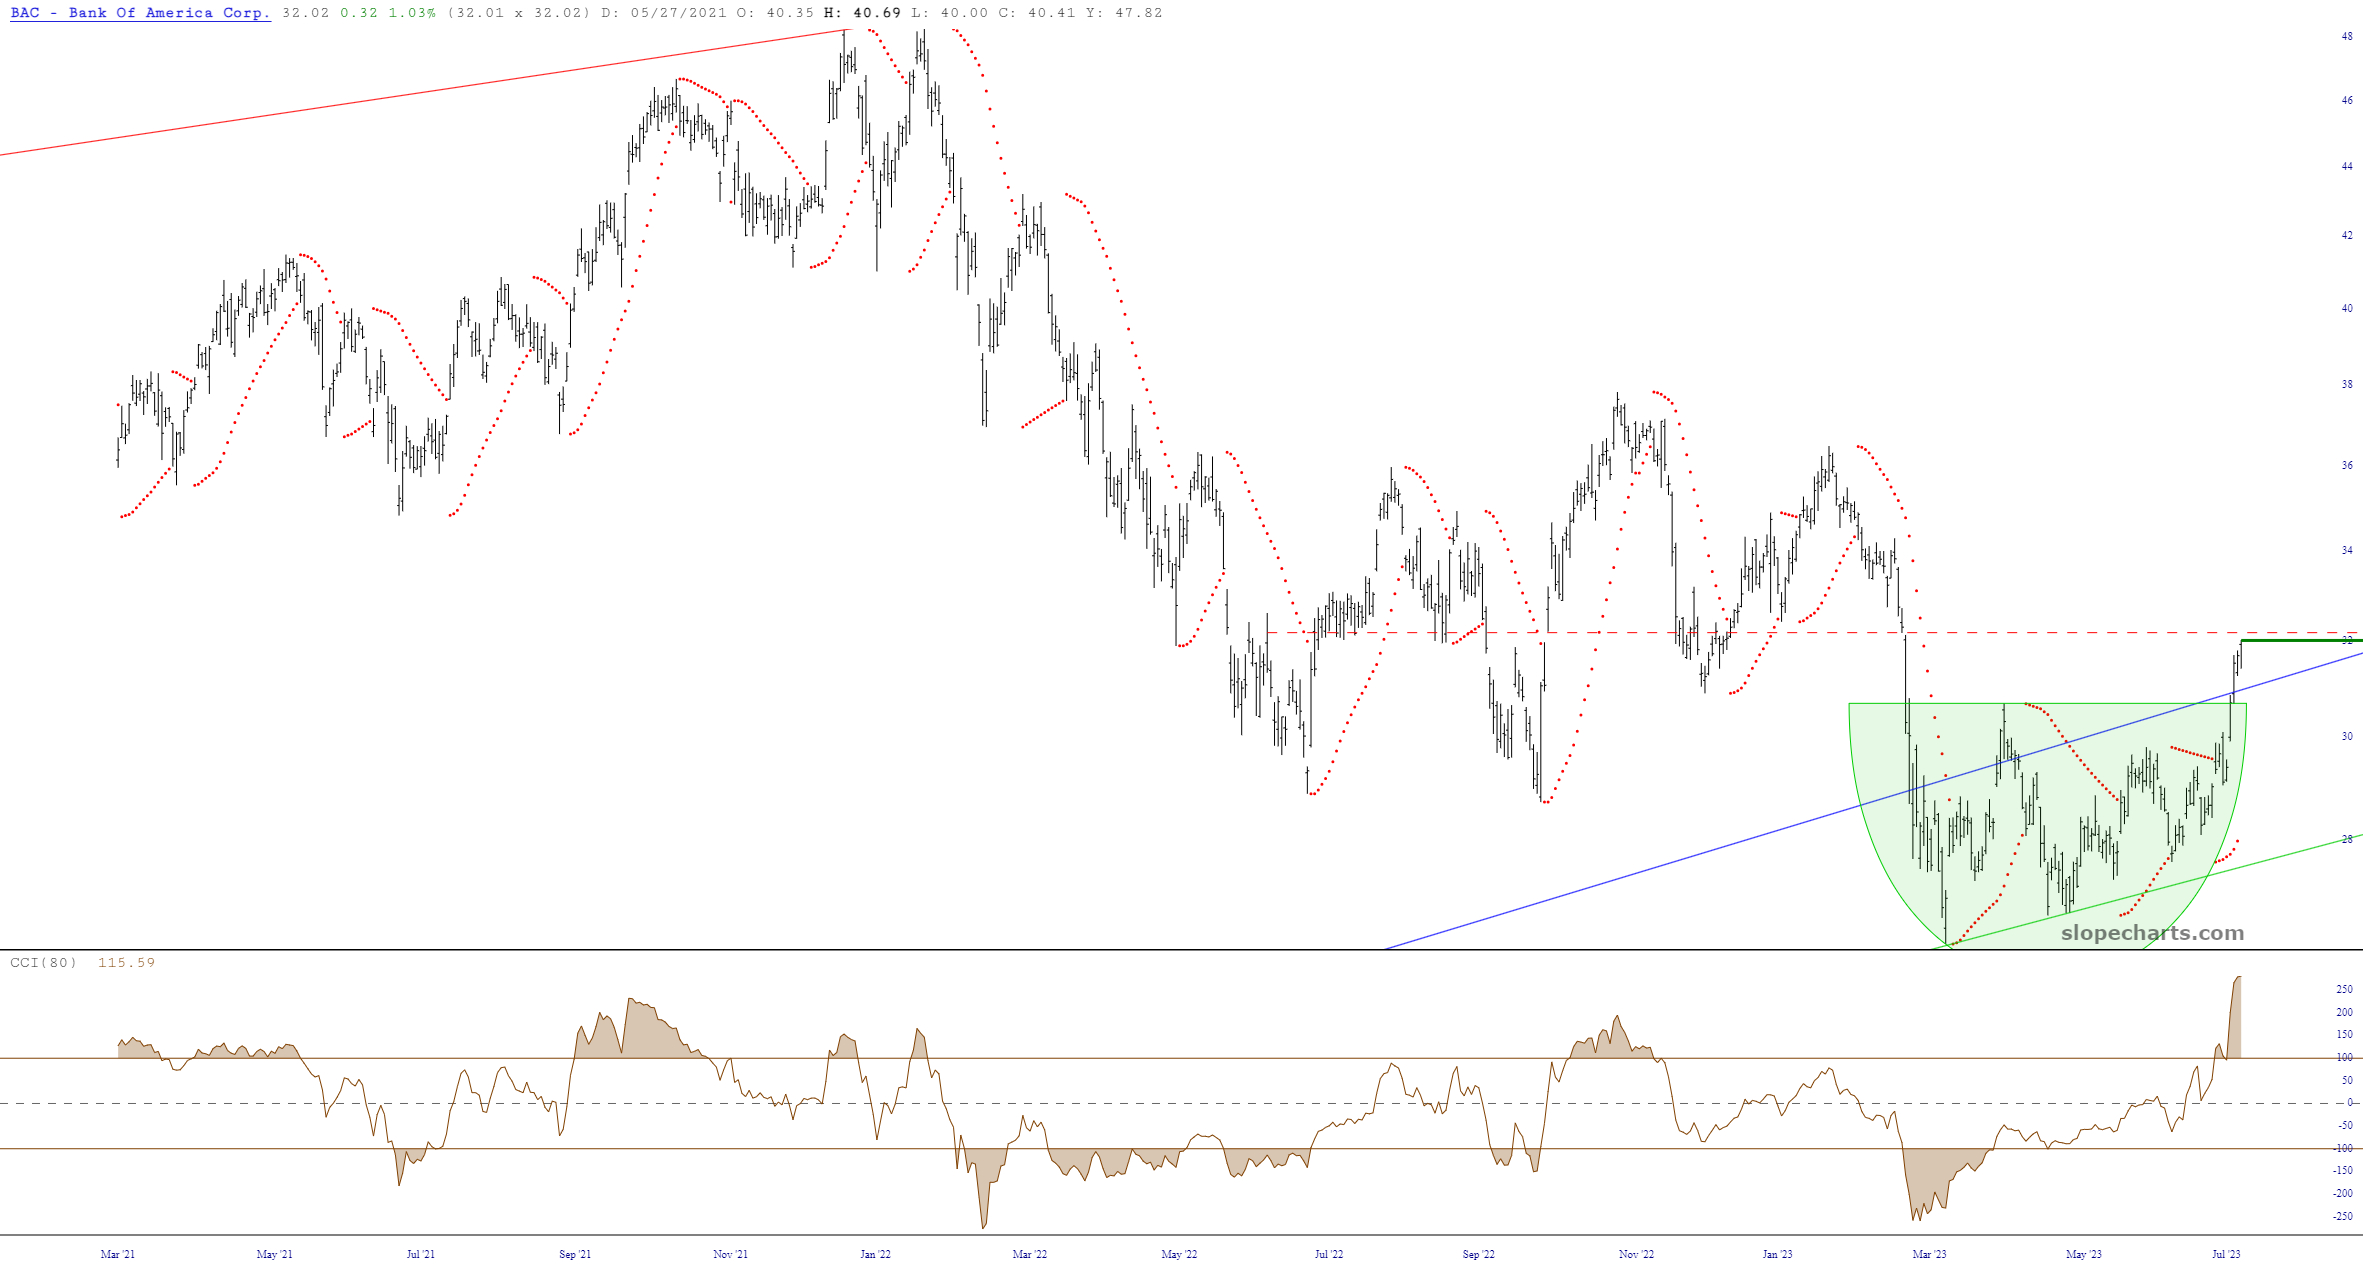
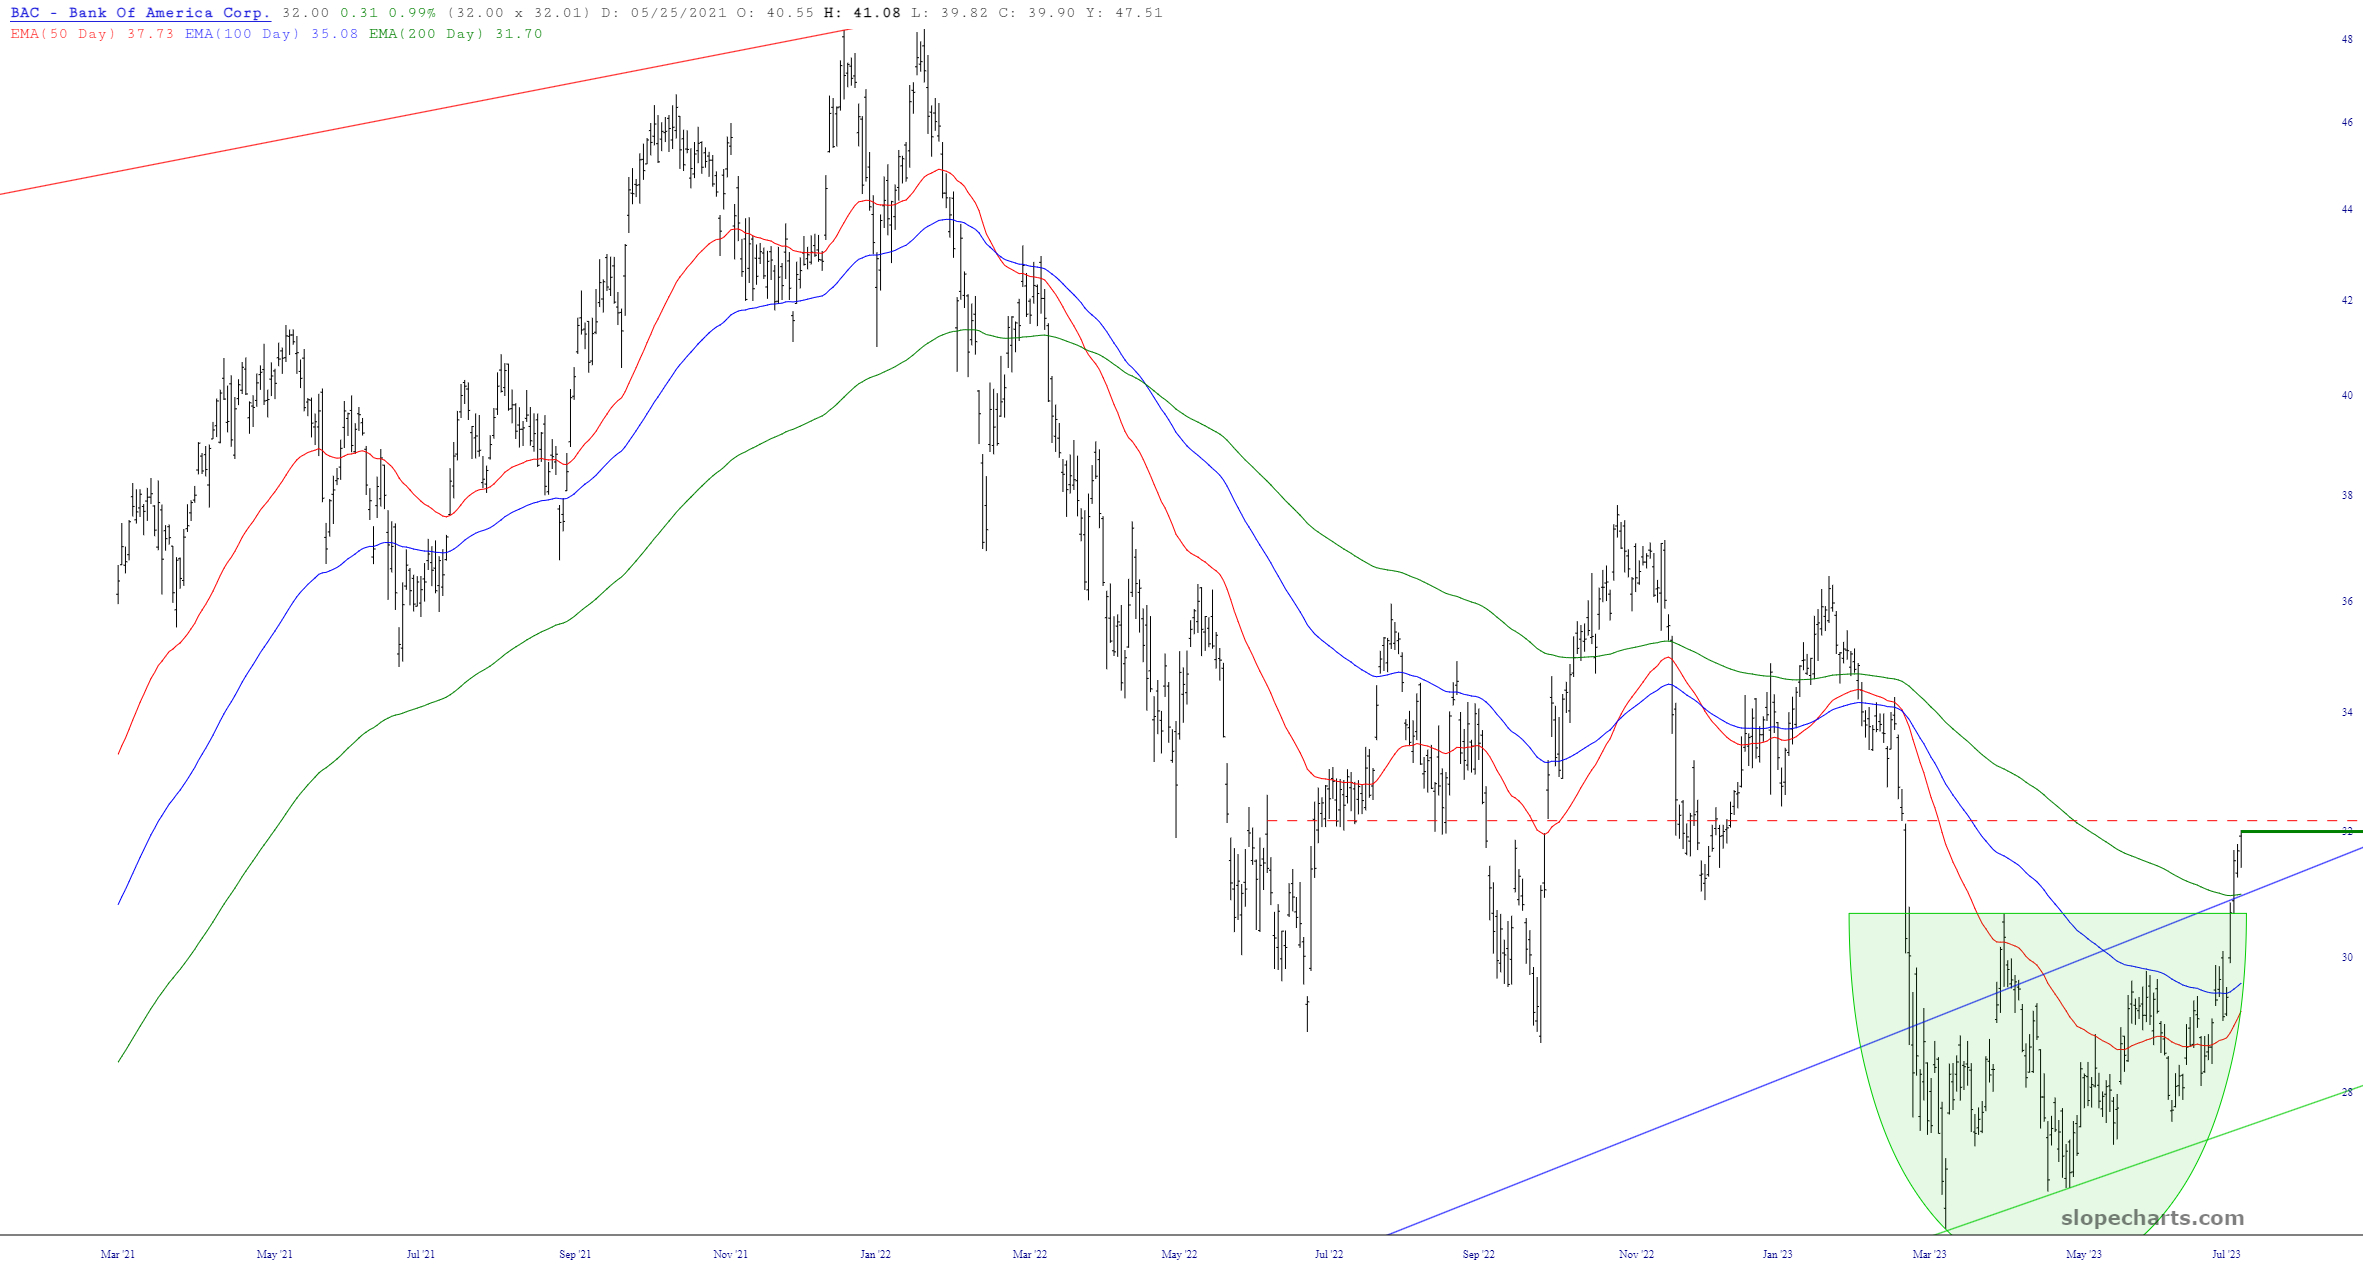
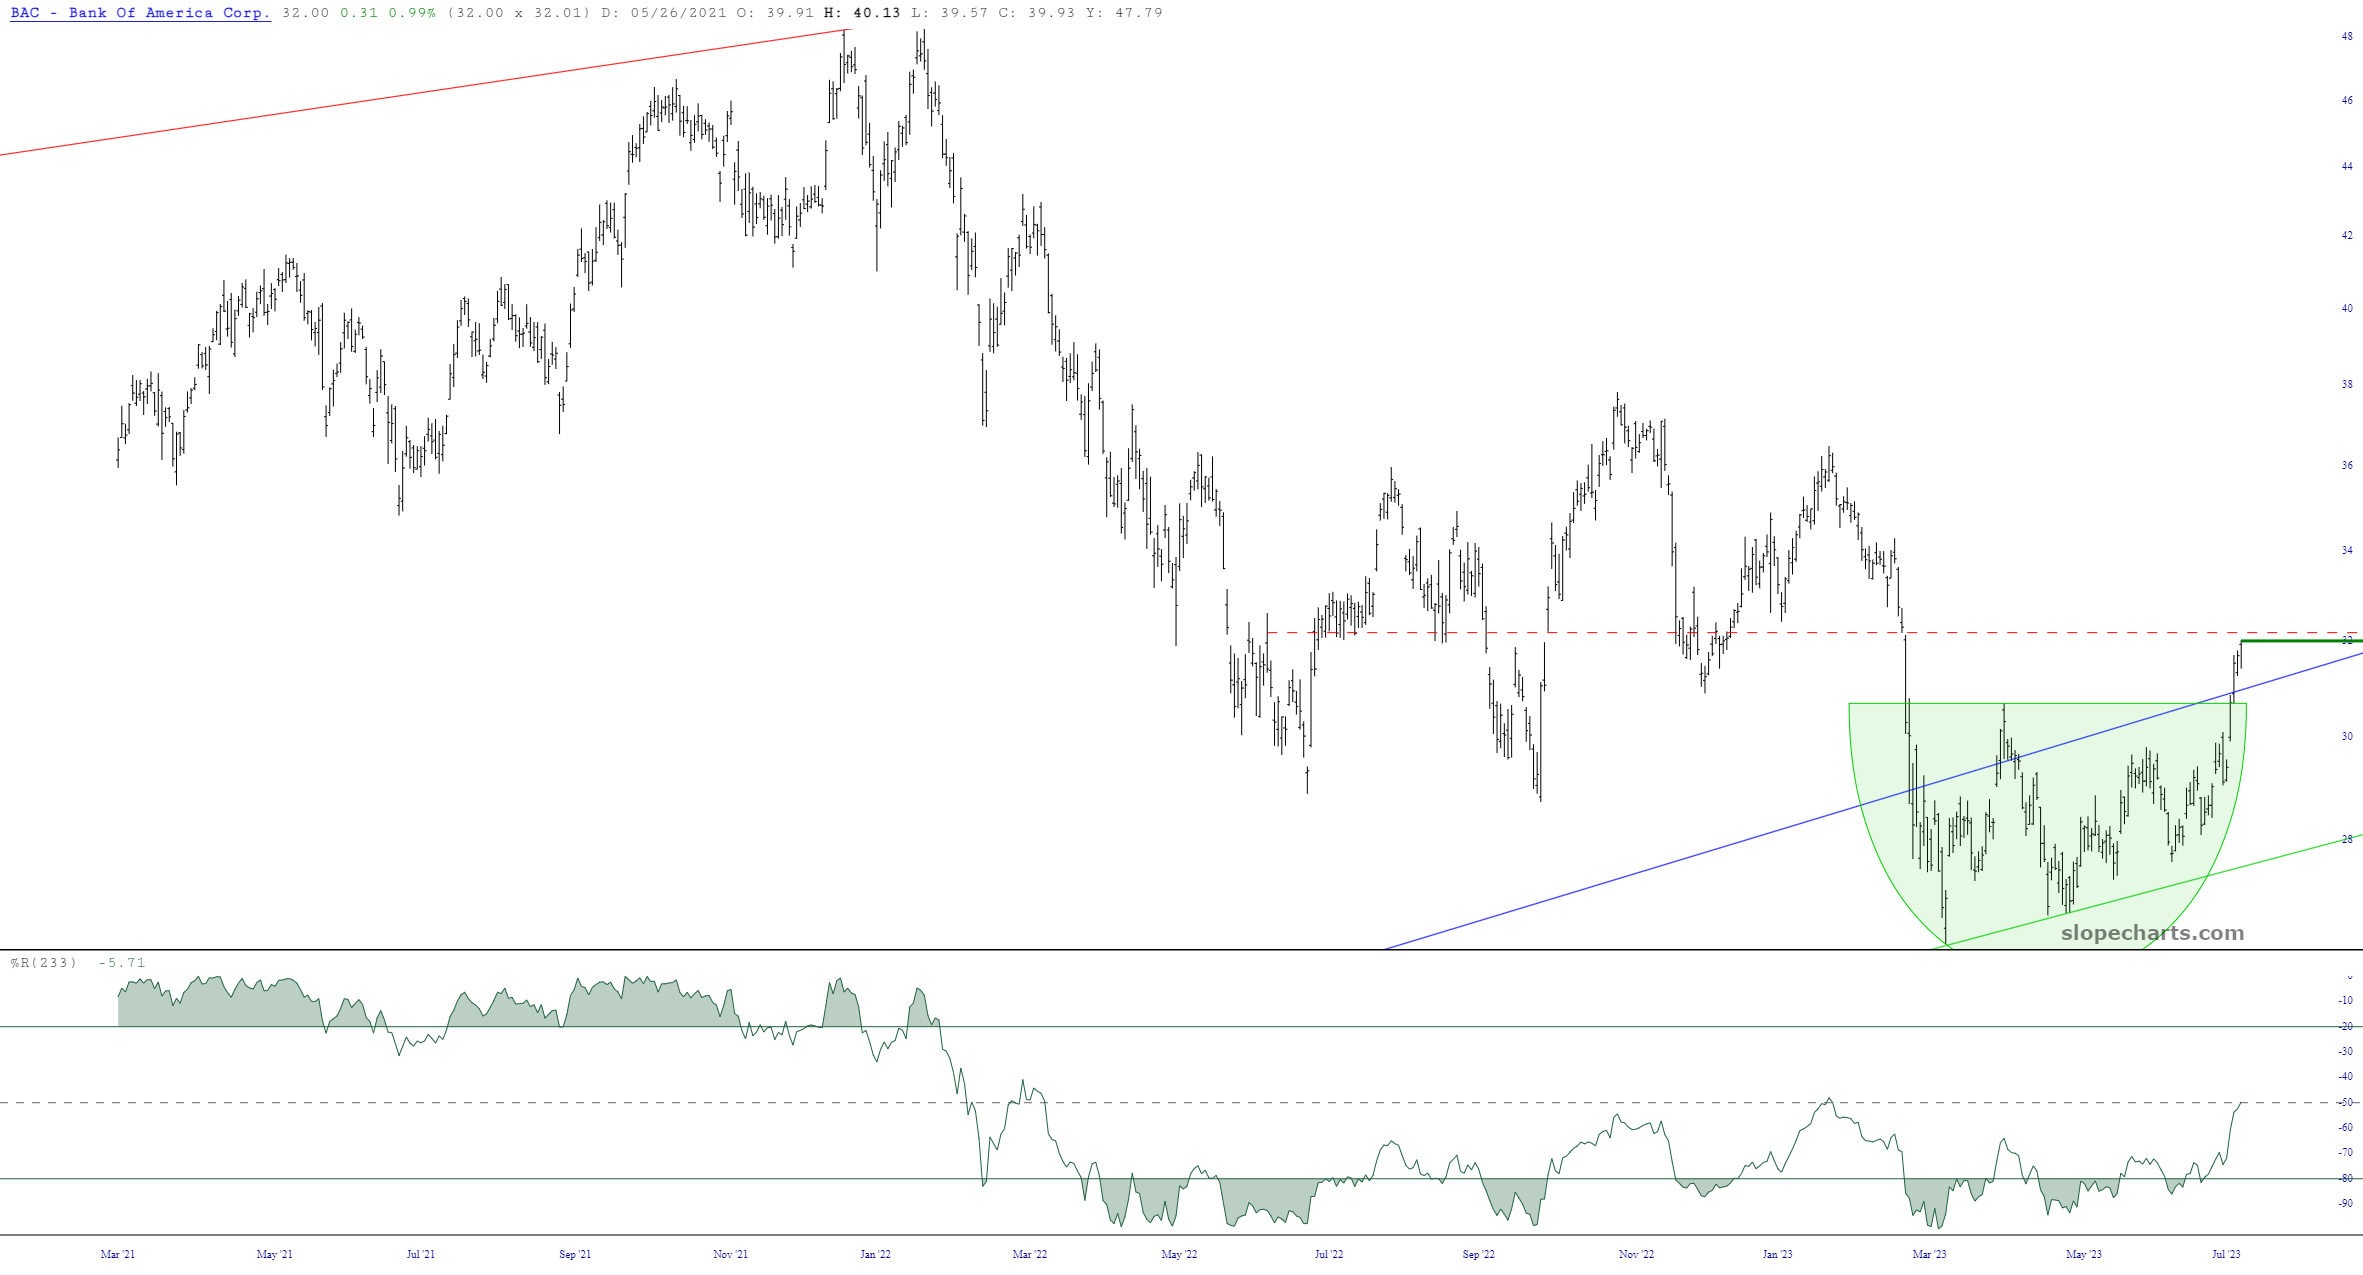
Here we see both CCI and %R, which are used for overbought/oversold indications, showing how overbought the stock is presentlyHere is the CCI (Commodity Channel Index) on a longer-term scale. You can again see how extreme the present value is.The standard trio of exponential moving averages (50/100/200) has, amazingly, not had a single bullish crossover recently.Here is the %R over a longer time horizon. What’s curious is that, in recent months, this indicator only tends to get to its midline before rolling over.