November is here. A wild 2023 continues to fly by unrestrained. In my last post, Autumn Fall, I was looking for weakness to take hold in the markets from the beginning of August through the end of November. The weakness that we have seen over the past three months in markets is what I was anticipating, with roughly 20% declines in IWM and IYR. As we enter into the beginning of November I ask the question: Is the selling over for this year, or will there be more bearish opportunities in November?
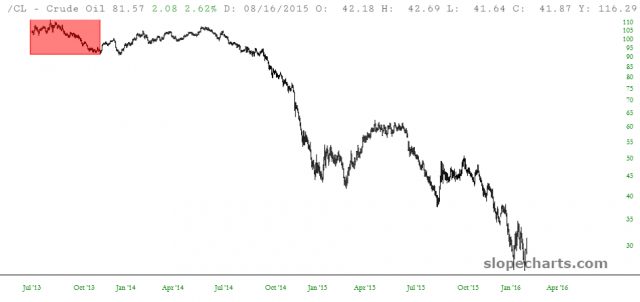
To attempt to answer that question we’ll be looking at the crude oil analog, as well as the November setups for IWM, SPY, IYR, and XLF. The crude oil analog below is the chart that I showed in Autumn Fall. The red box in the top left is the time period of August – November 2013, which should be echoing through the broader market August – November 2023. The analog is not anticipating the weakness in the broader market to stop until the end of November, followed by a December bounce.
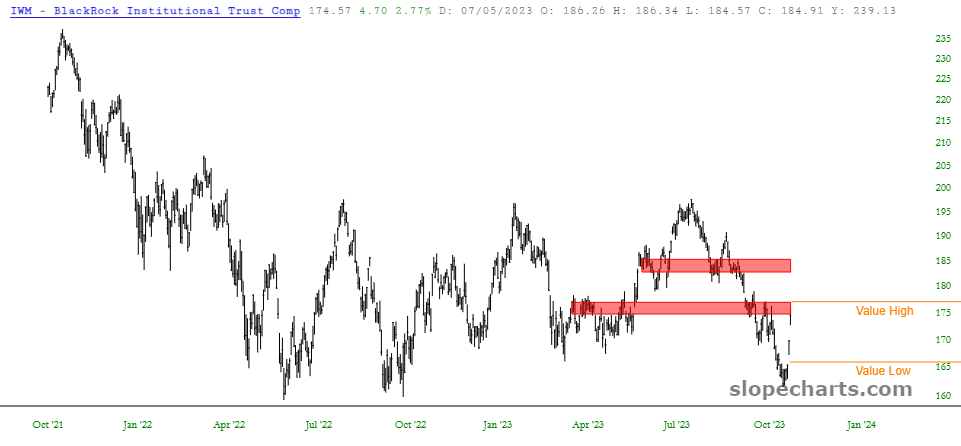
Next, let’s take a look at IWM. With the weakness that we have seen this fall, the small caps have continued to diverge lower from the large caps. As August began, IWM found resistance at the highs of the previous year. The ETF then proceeded to fall roughly 20%, finding support at the lows of 2022. One key difference between this fall’s weakness, and the weakness that we saw in Feb/March of this year, is that to date we have not yet seen any bank failures or the Fed step in to add liquidity. I think this is good for the bears.
Looking at the chart of IWM below, I have highlighted the two key clusters of POC support/resistance with the red boxes. Value high and low for this month are shown as well. Value high is at 177.2, and value low is at 166.45. Last week’s big advance took IWM into the first large cluster of POCs, as well as close to value high. From the bearish perspective I would not want to see IWM rise above value high this month. That would be a reg flag to me. For traders looking to maximize profits and limit risk this month, value high and low will likely be two important pivots for November.
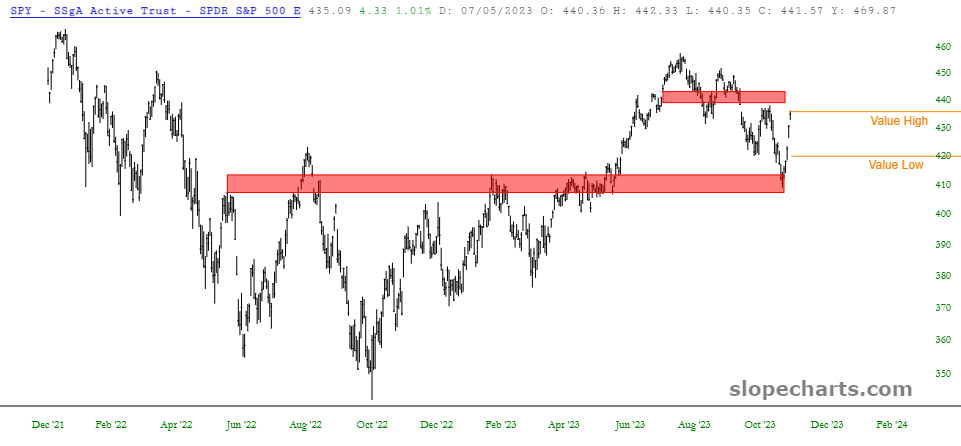
The chart of SPY is shown below, and looks noticeably different from the small caps. The liquidity that came into the market after the spring banking bailout had a more outsized impact on large cap stocks. Looking at the two key clusters of POCs that I have highlighted in the red boxes, SPY responded to the added liquidity by breaking above key POC resistance in May/June of this year. The decline that we have seen thus far this fall simply fell back to retest that breakout. Therefore, I would contend that the bottom red box is a key area of support/resistance.
The market’s advance last week bounced hard off that support and moved straight up to value high for November. Value high is at 436, and value low is at 420. Above value high I would lose interest in bearishness for SPY in November. Under value low I would get excited from a bearish perspective. If SPY manages to break under the October lows this month, something more substantial is likely underway, evidenced by breaking under the key POC area of support. Again, I think value high/low will be important pivots to trade around this month.
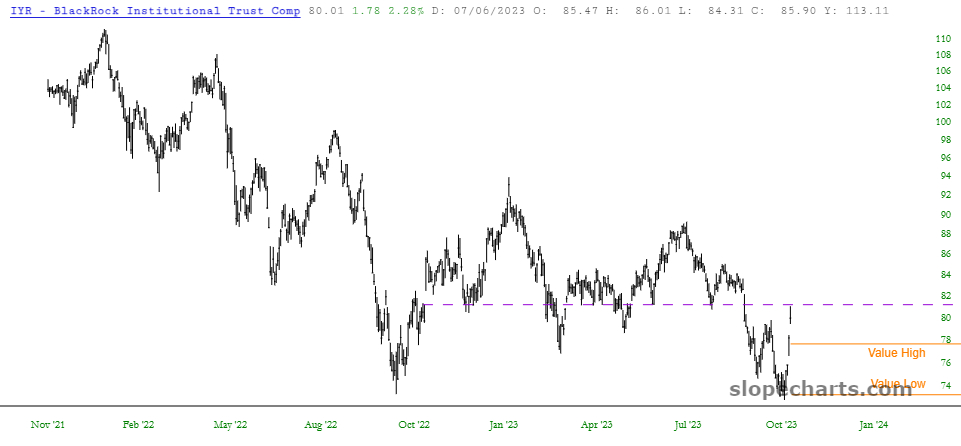
IYR, representing commercial real estate, continues to be a favorite trading vehicle of mine. The 20% decline since the start of August was met with a very large bounce back to begin the month of November. The bounce saw almost a 50% retrace of the entire August-October move.
Looking at the chart below, a few key points to take away. First, IYR managed to make a new lower low, taking out the low of October 2022. Second, I think last week’s bounce may have found an interesting area of resistance, shown in the dashed line. IYR has also quickly moved back to an overbought condition, while remaining within its overall bearish downtrend. This can also be seen with how far price has already moved above value high for this month. Value high this month is at 77.7, and value low at 73.32. If IYR manages to break back under value high this month, I would expect it to move all the way back down to value low before the month is done. If we are going to see any major bearish fireworks in the broader market this year, a break in IYR below value low will likely give one of the best warning signs.
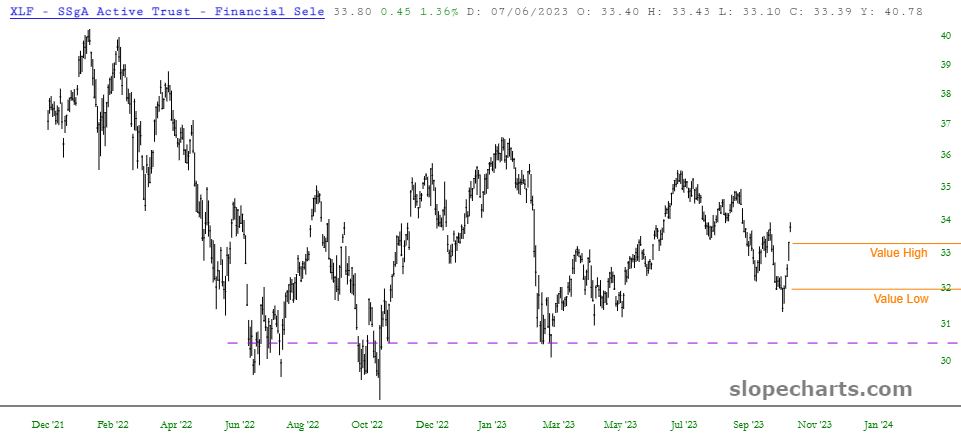
Lastly, I wanted to take a look at the financials. The chart of XLF is shown below. Value high this month is at 33.31, and value low is at 32. The dashed line I have at 31.50, which corresponds to where the Covid breakdown began. XLF, similar to IYR has remained in a bear market since the beginning of 2022. However, this fall’s weakness did not take out last year’s low. A break under value high would be the first bearish sign for XLF in November, and would likely lead to a move all the way back down to value low by the end of November. As always, good luck in the trading!