The rally which took place on Tuesday, November 14th, following the very weak CPI report, was one of the biggest events of 2023 for equity bulls, if not the biggest. The Dow rose almost 500 points, the S&P rose almost 100 points, and the Russell 2000 climbed an eye-popping 5.44%. Below are eight exchange-traded funds (ETFs) in particular interesting setups following this mega-rally.
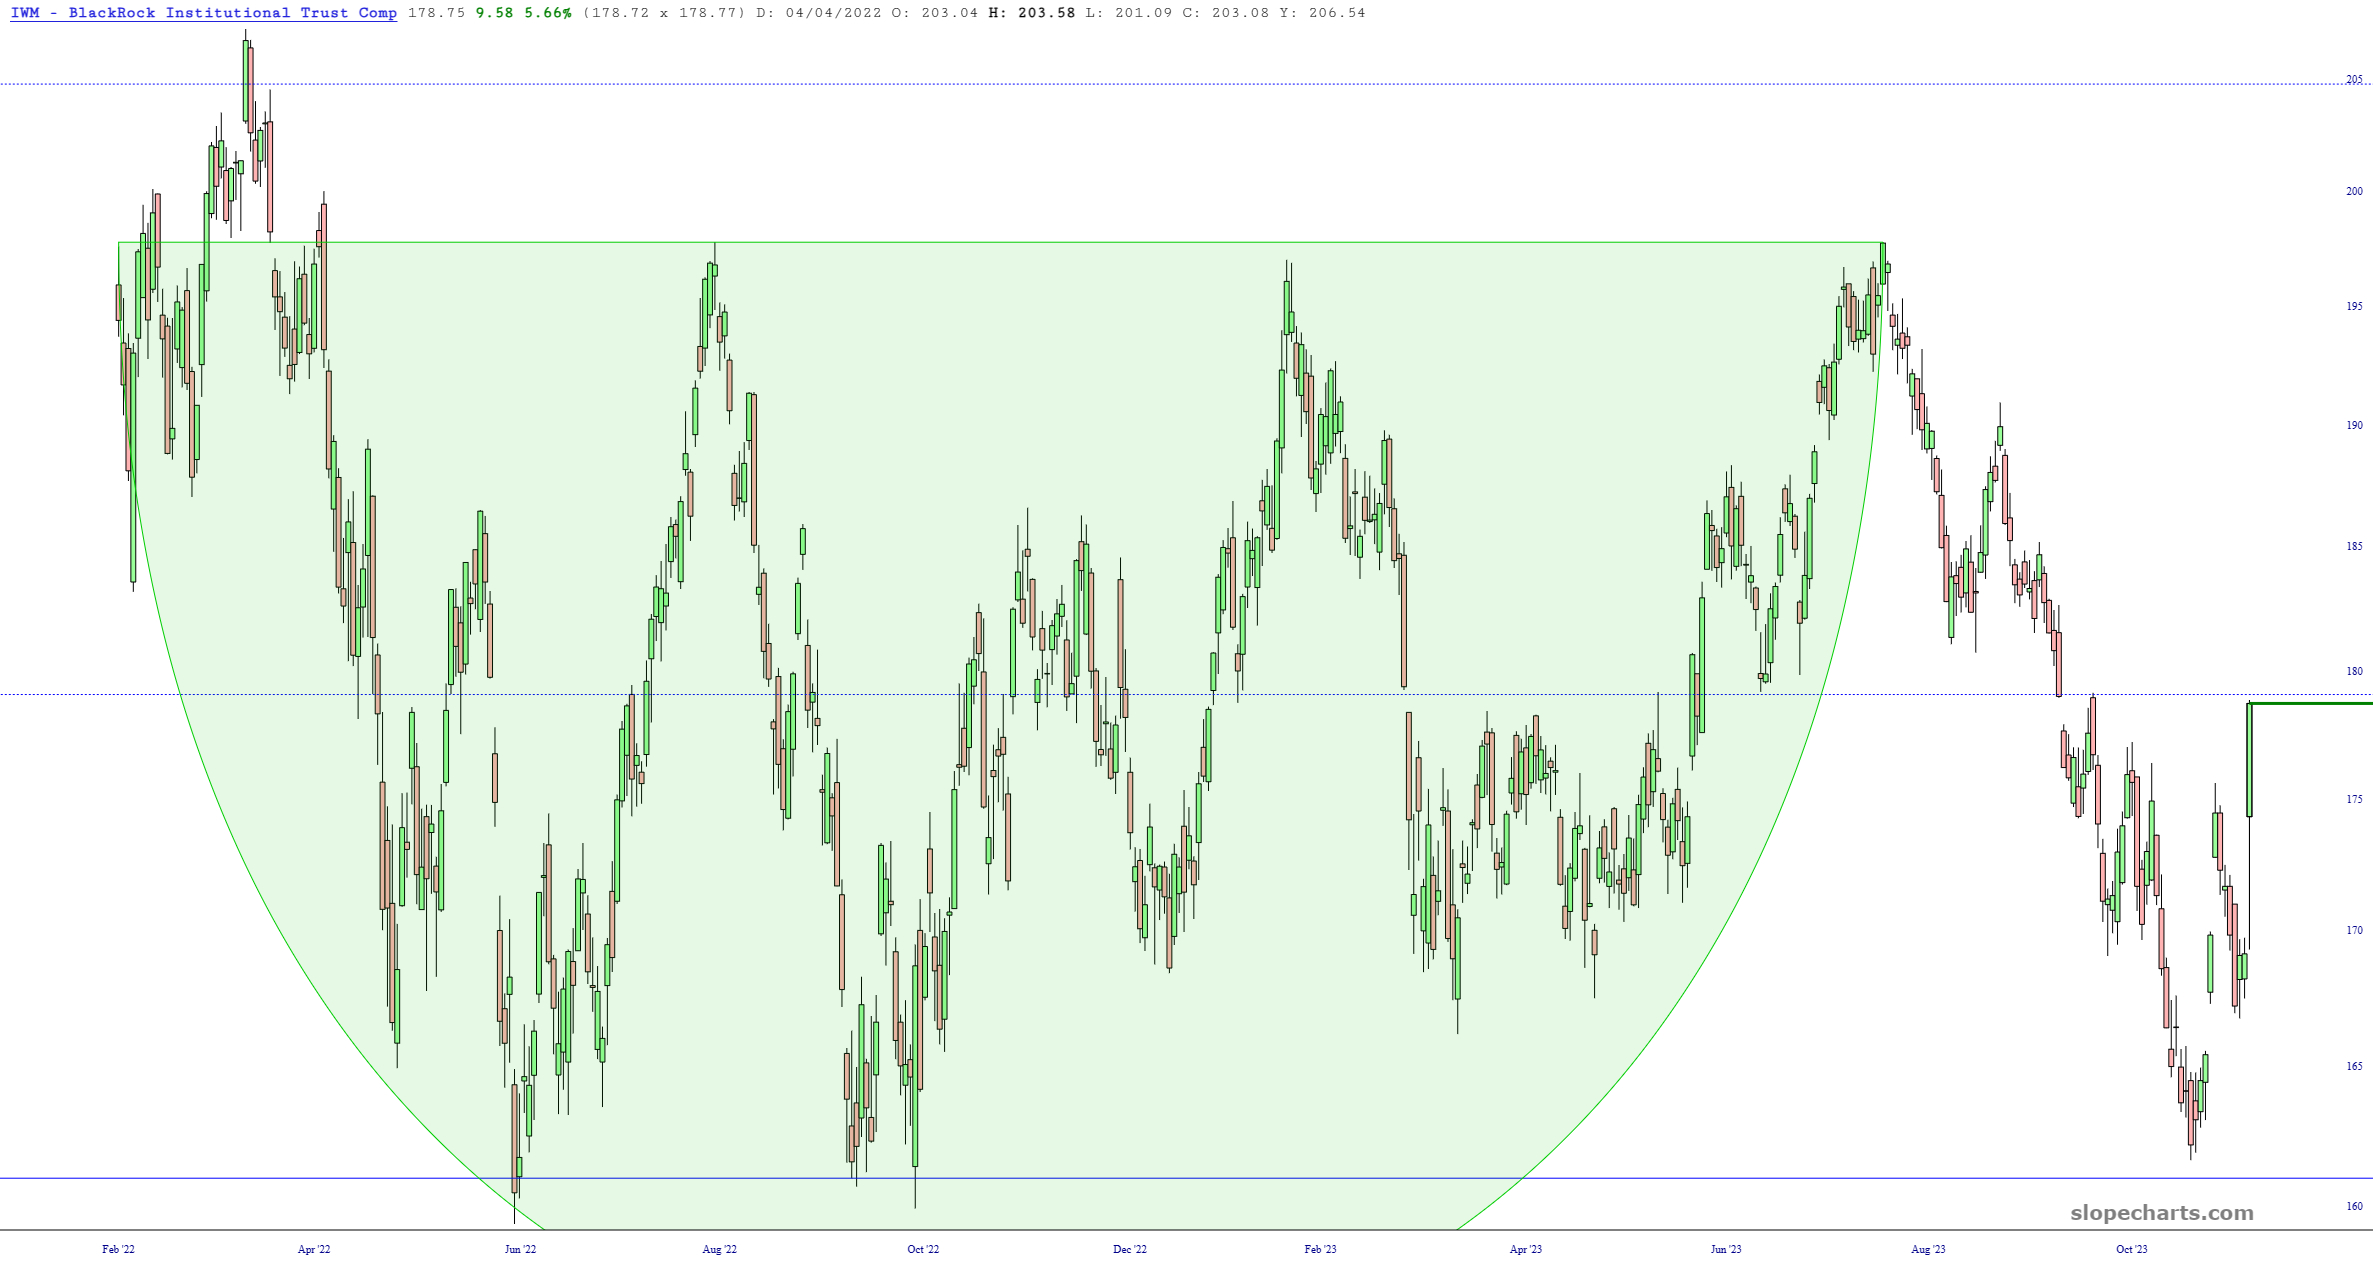
We start with the small caps, which have been range-bound at this point for years. The Fibonaccis have had an extremely powerful influence, acting as either support or resistance, and in just the past couple of weeks, and IWM has rallied from one Fib (as support) to another (as resistance). The price is just about at the midpoint, which should provide a meaningful barrier to further price ascent without some important new catalyst to propel it over the midline.
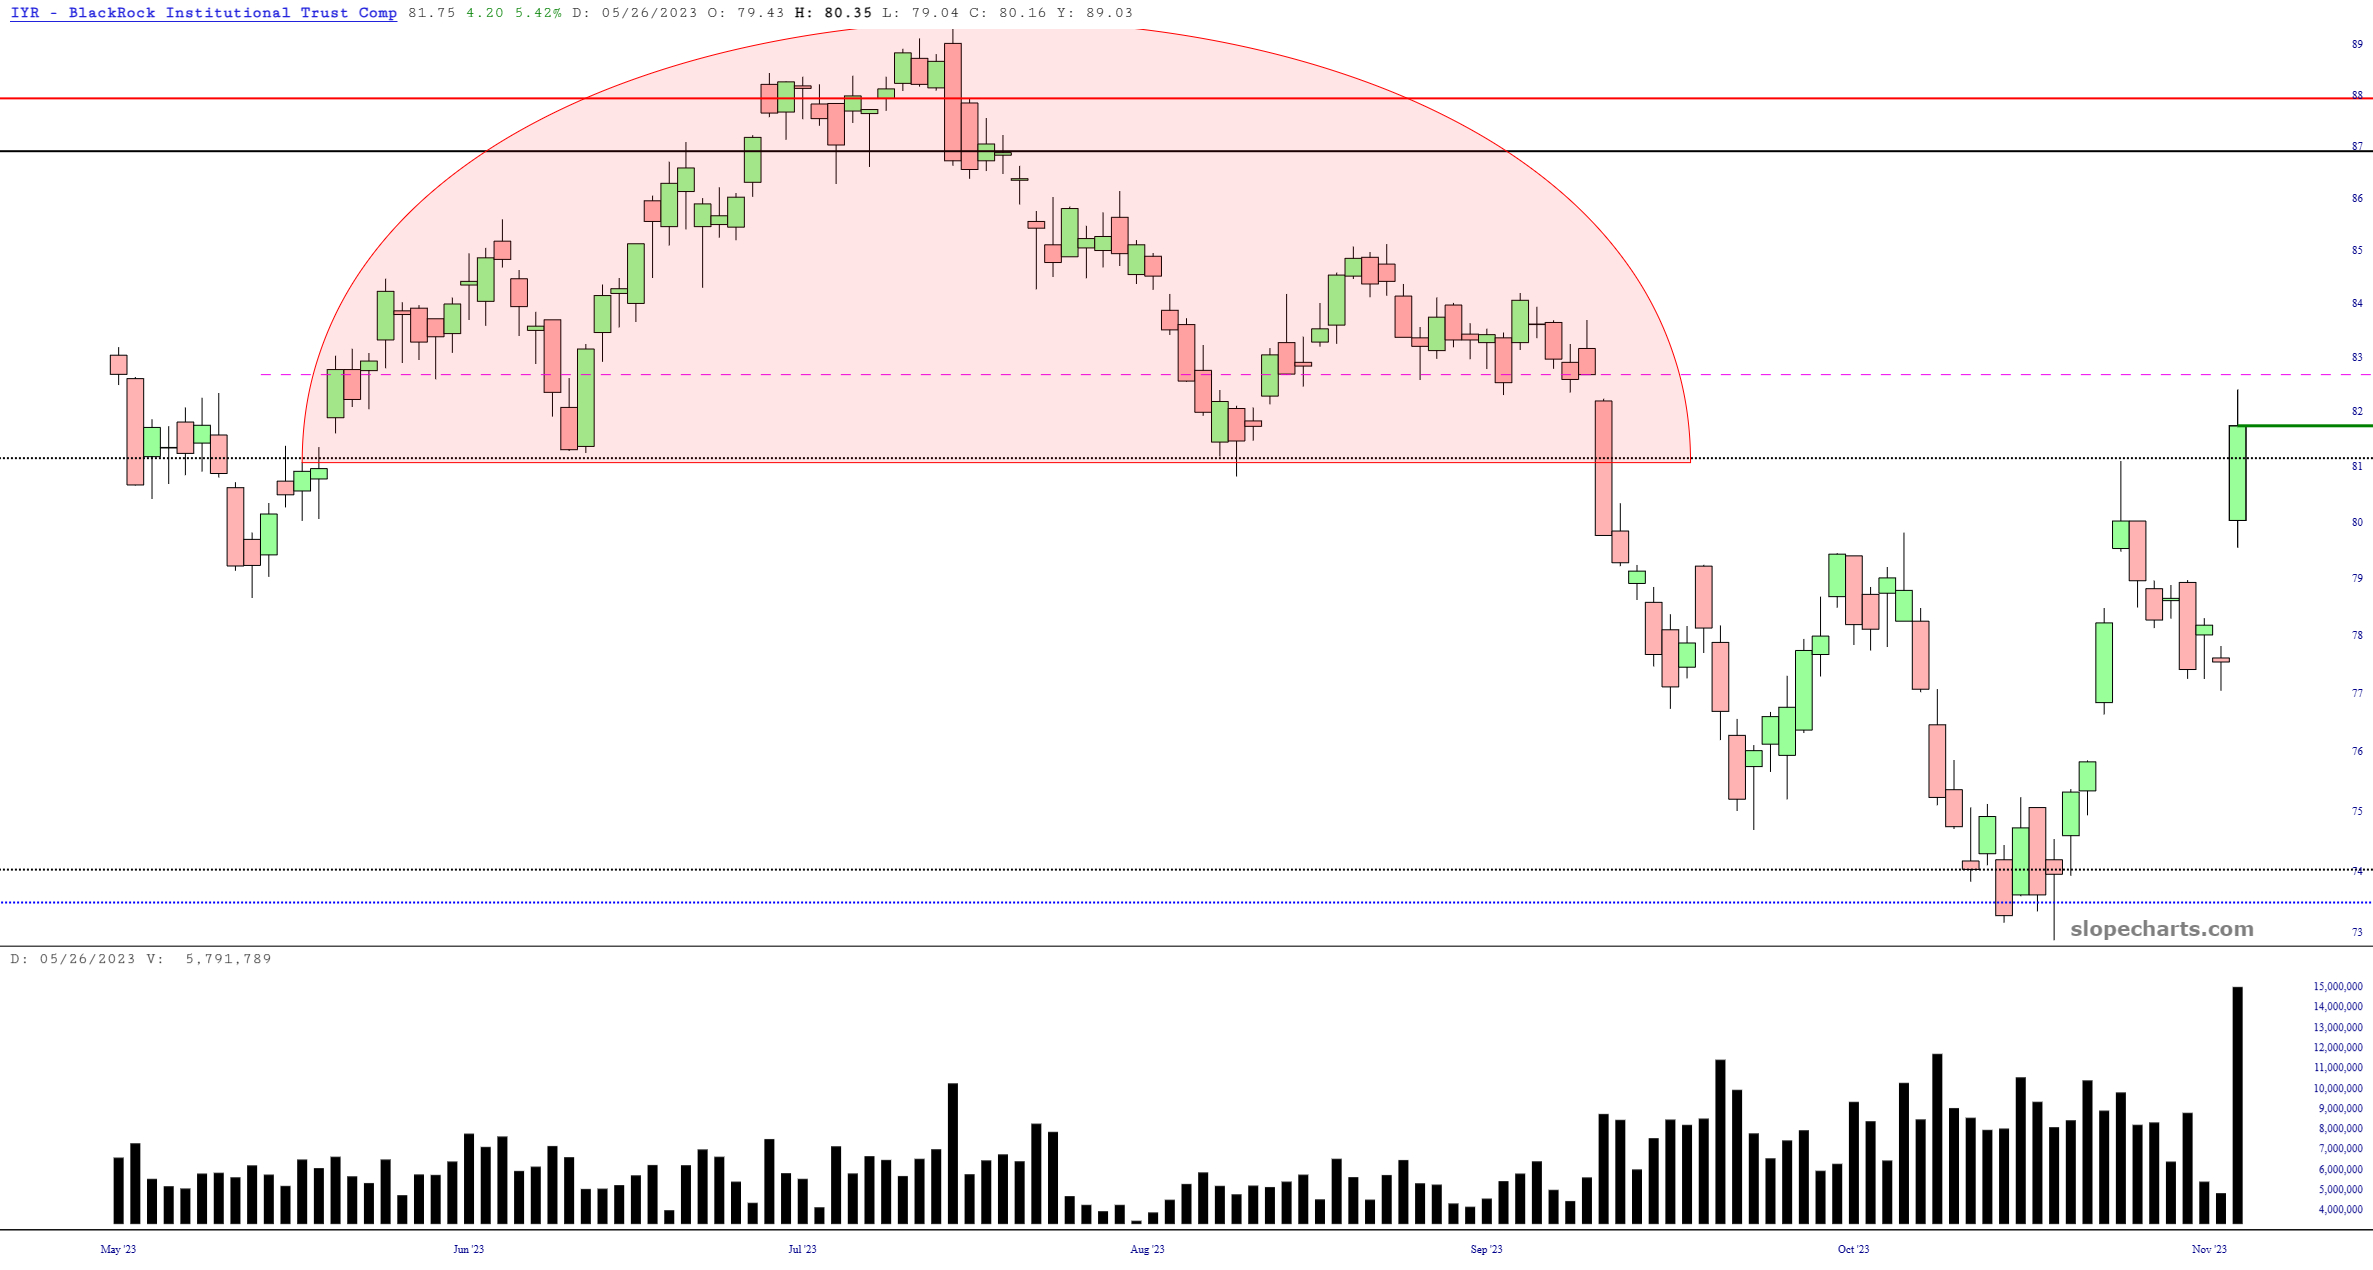
The real estate fund has pushed into the pink zone defining the head & shoulders top, damaging the credibility of that pattern. The real test will come in the form of the price gap, which it has neither sealed nor exceeded. This is the one chart, incidentally, in which volume is also shown, because the extraordinary increase in volume on Tuesday (the highest in many, many months) is worth including.
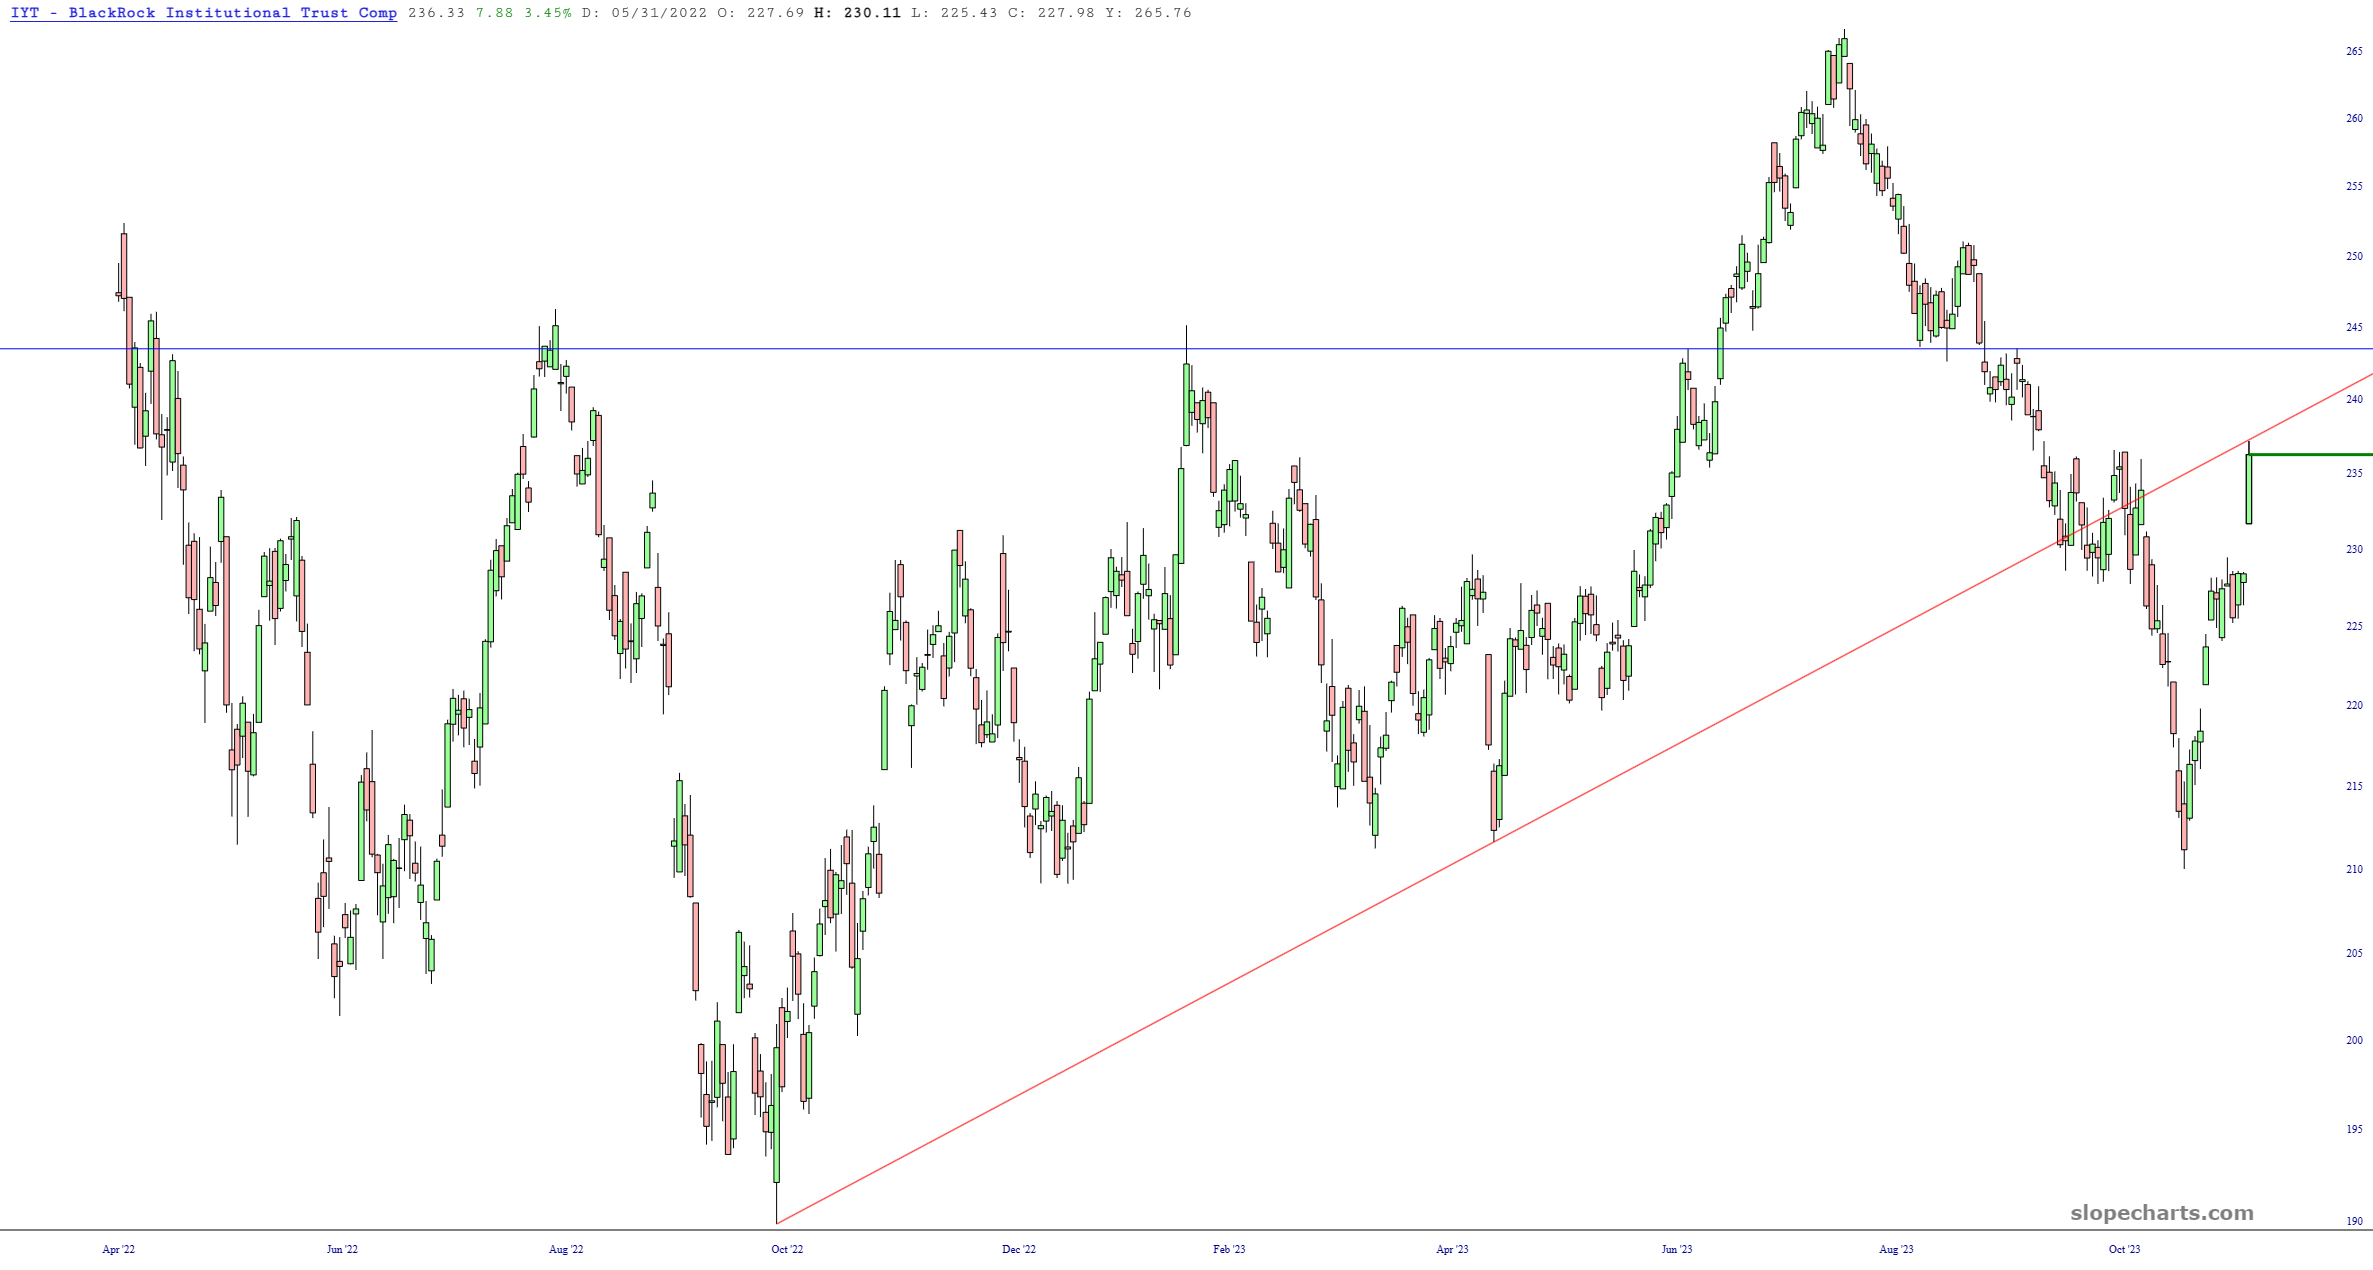
One of the cleanest trendline-based setups is in the form of the Dow Transports, which is sporting a pitch-perfect tag of its broken trendline (meaning that the price has approached the line in its role as resistance instead of its former role as support). It is unlikely to go much higher.
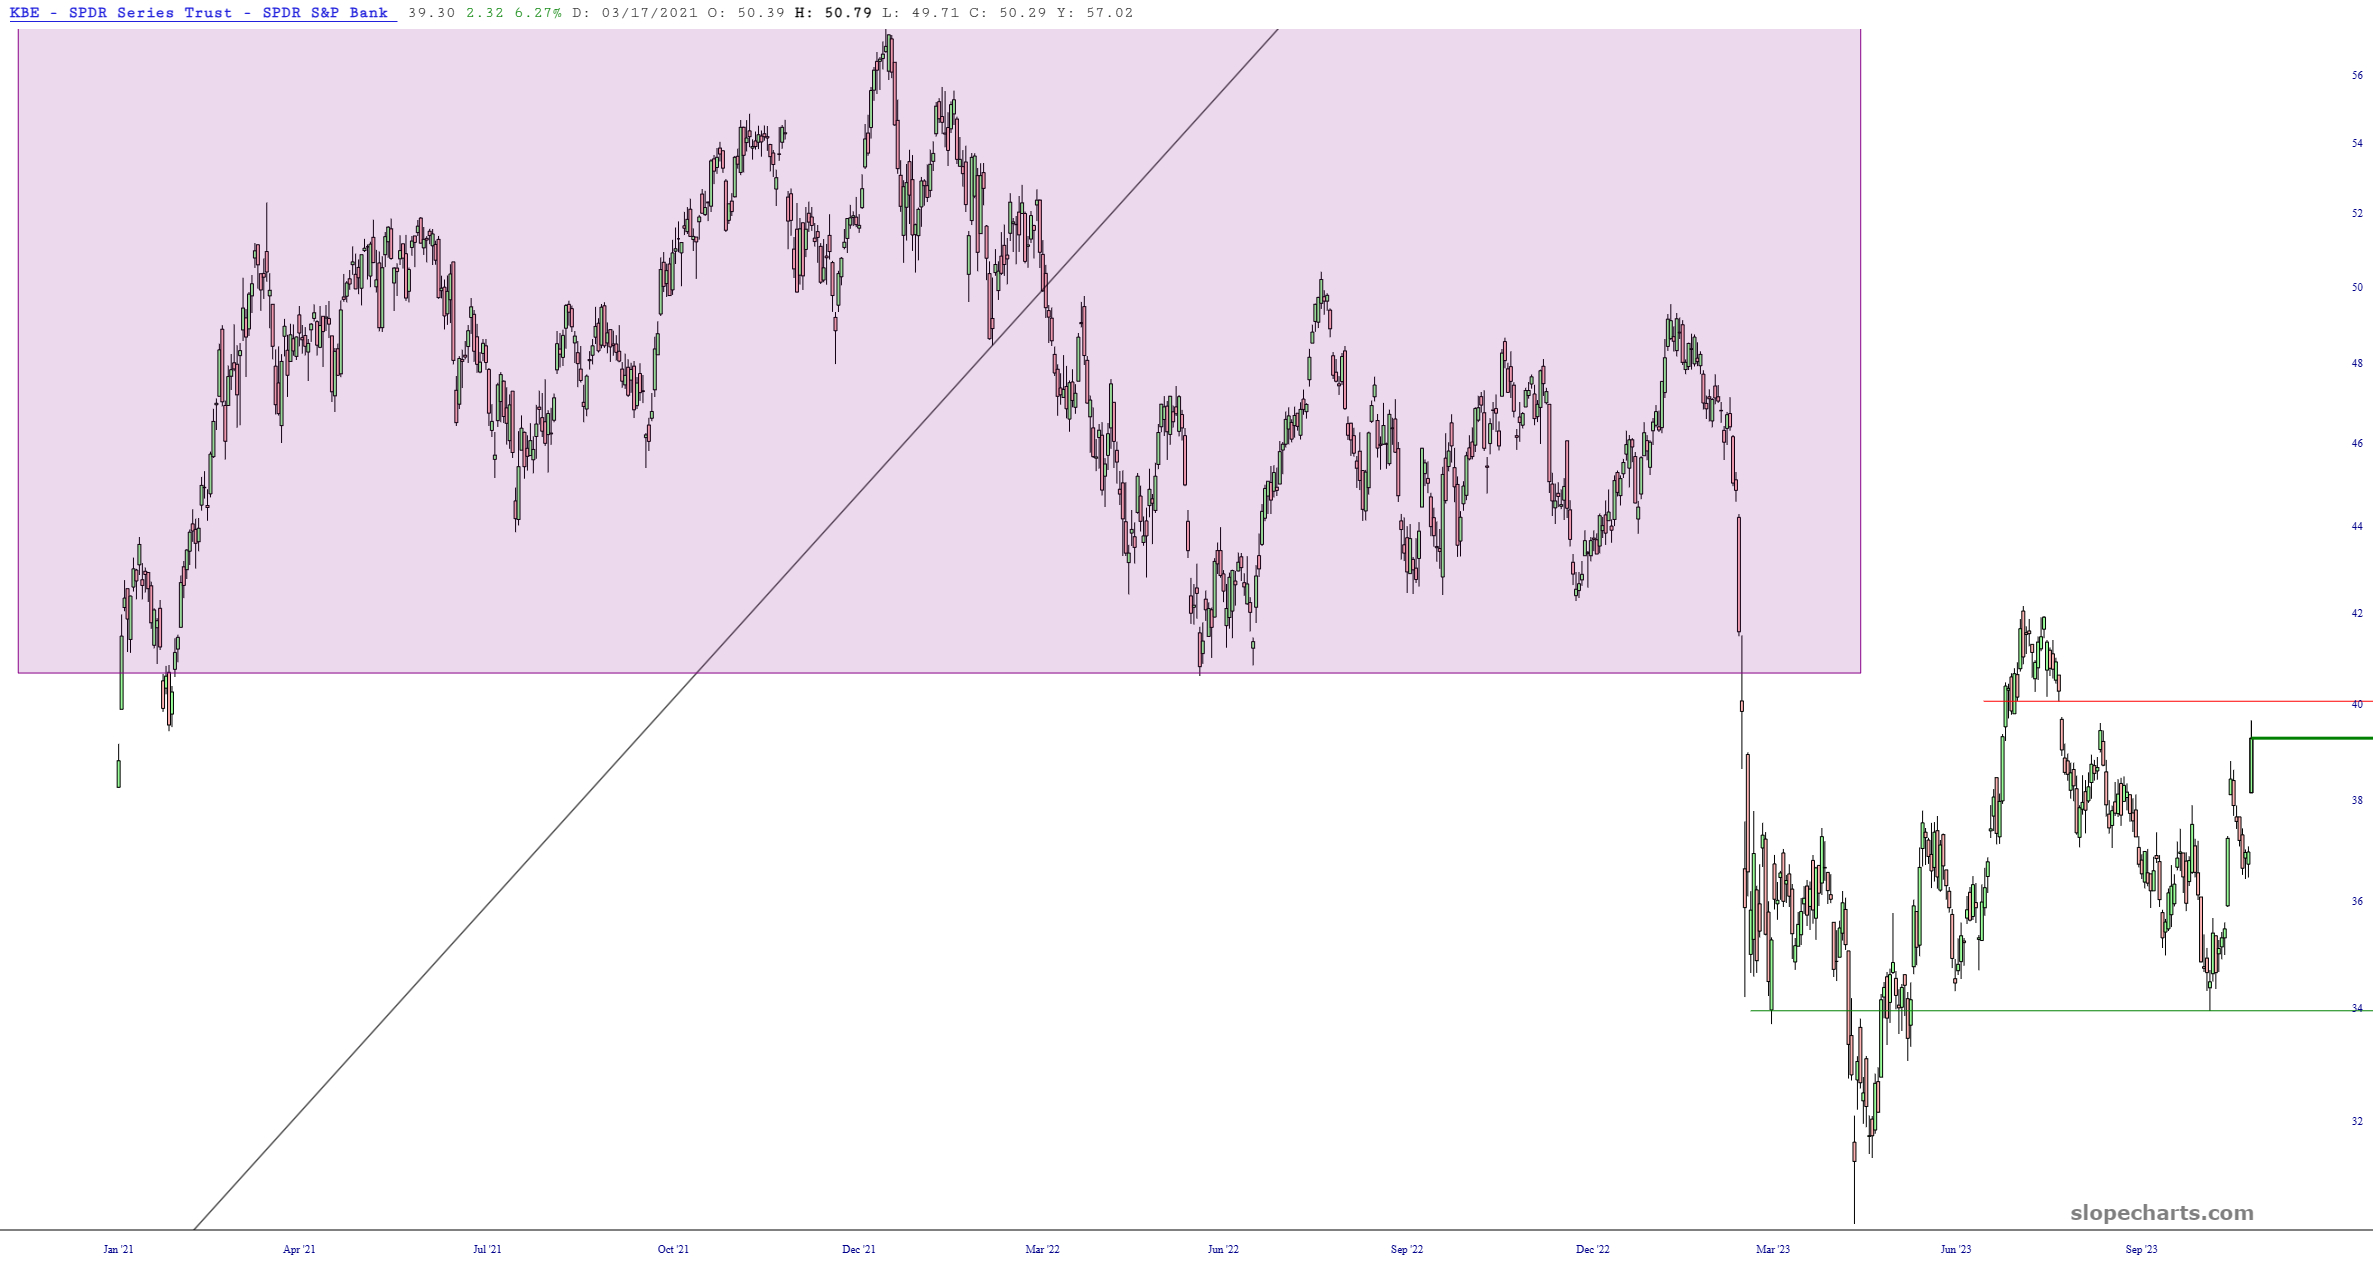
For the past couple of years, the regional banks have had an outsized influence on market direction, and once again we have a price gap to watch (in the form of the horizontal drawn on the chart) as an important resistance barrier.
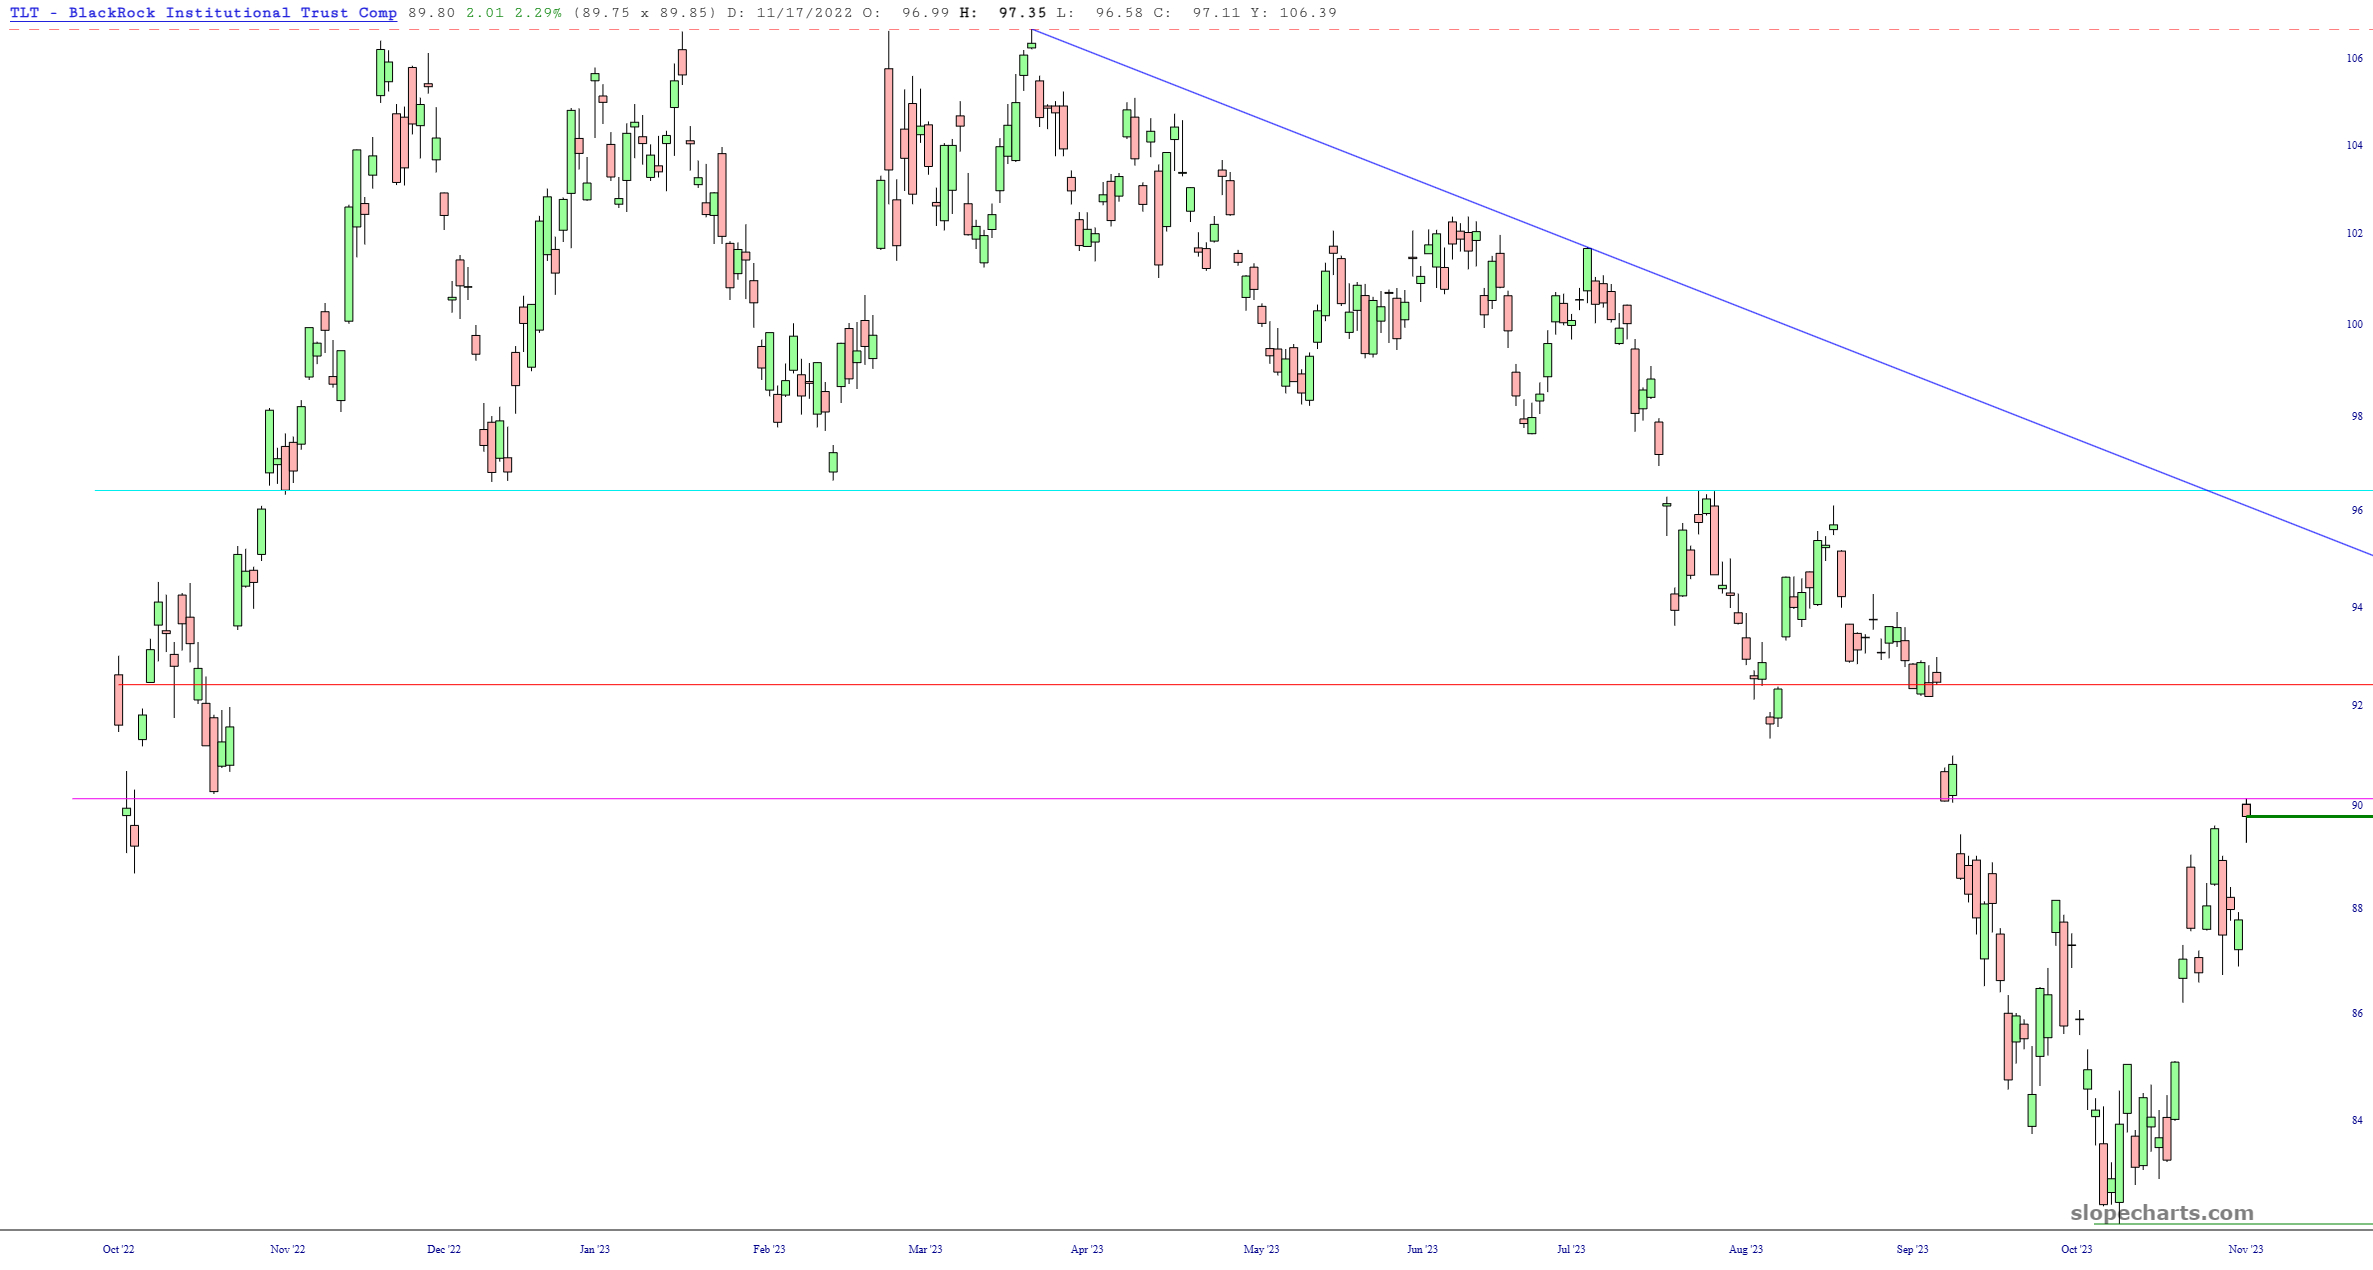
The bond market peaked about four and one half years ago, and although the rally over the past few weeks have been powerful, it does nothing to eradicate the longer-term bearish picture. The price gap here has already been sealed, and if assets are going to weaken at this point, they will probably be led by falling bond prices.
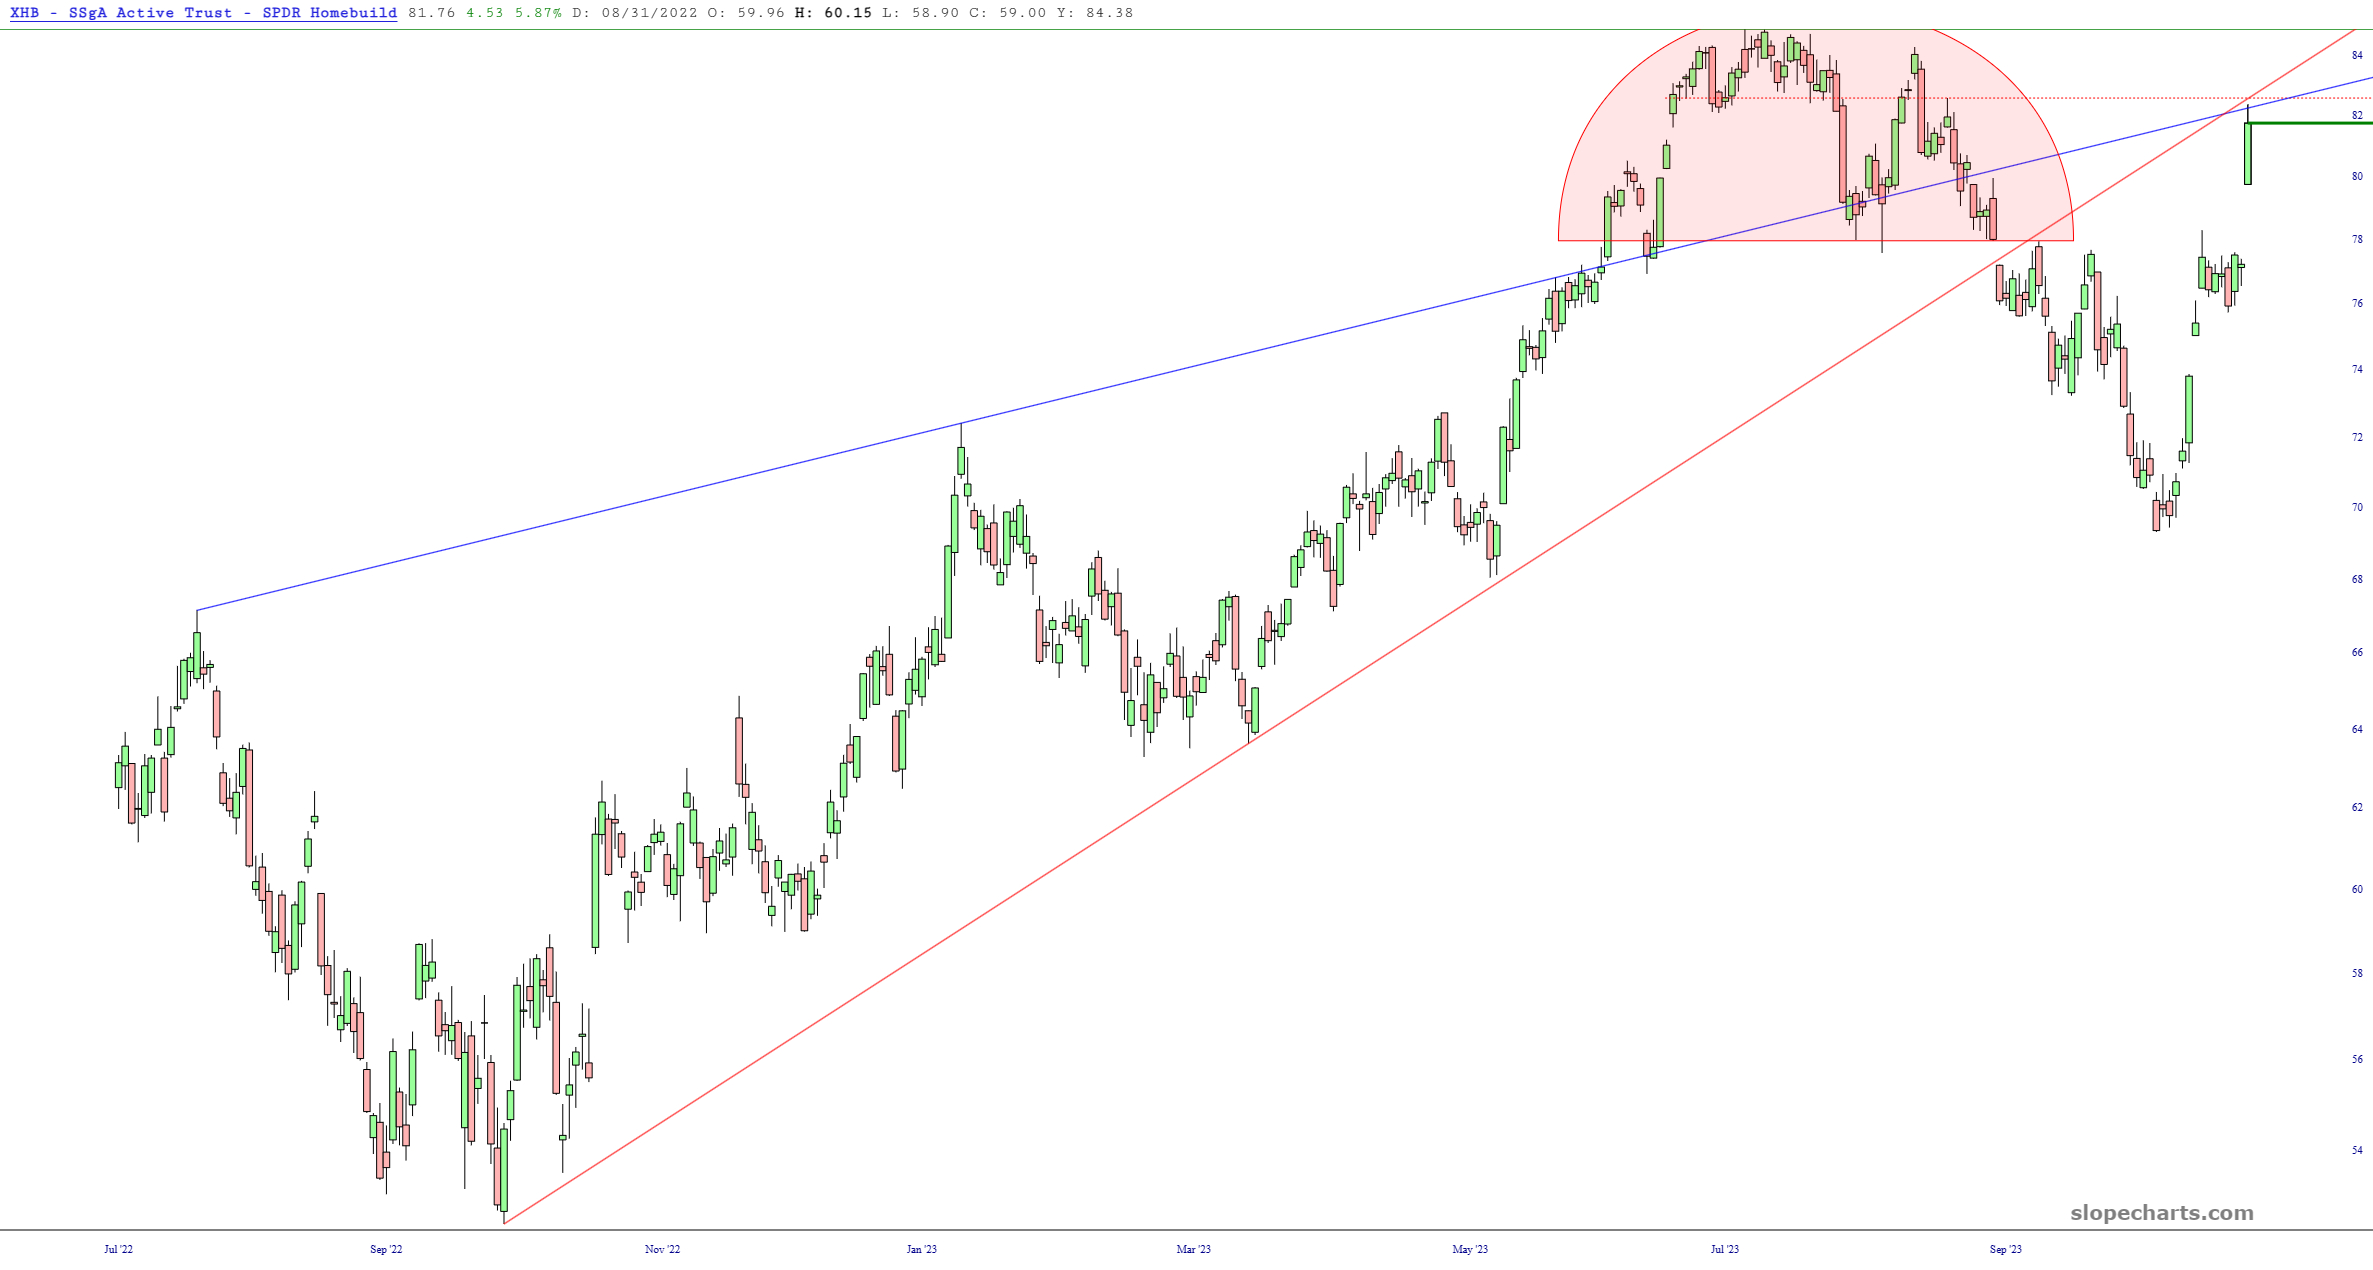
Perhaps the cleanest and most exciting setup out of all these charts is in the former of the XHB homebuilders fund, which recent price action have brought it almost precisely to the apex of its already-broken wedge pattern. There could be a violent repulsion of price action from this interaction of the trendlines.
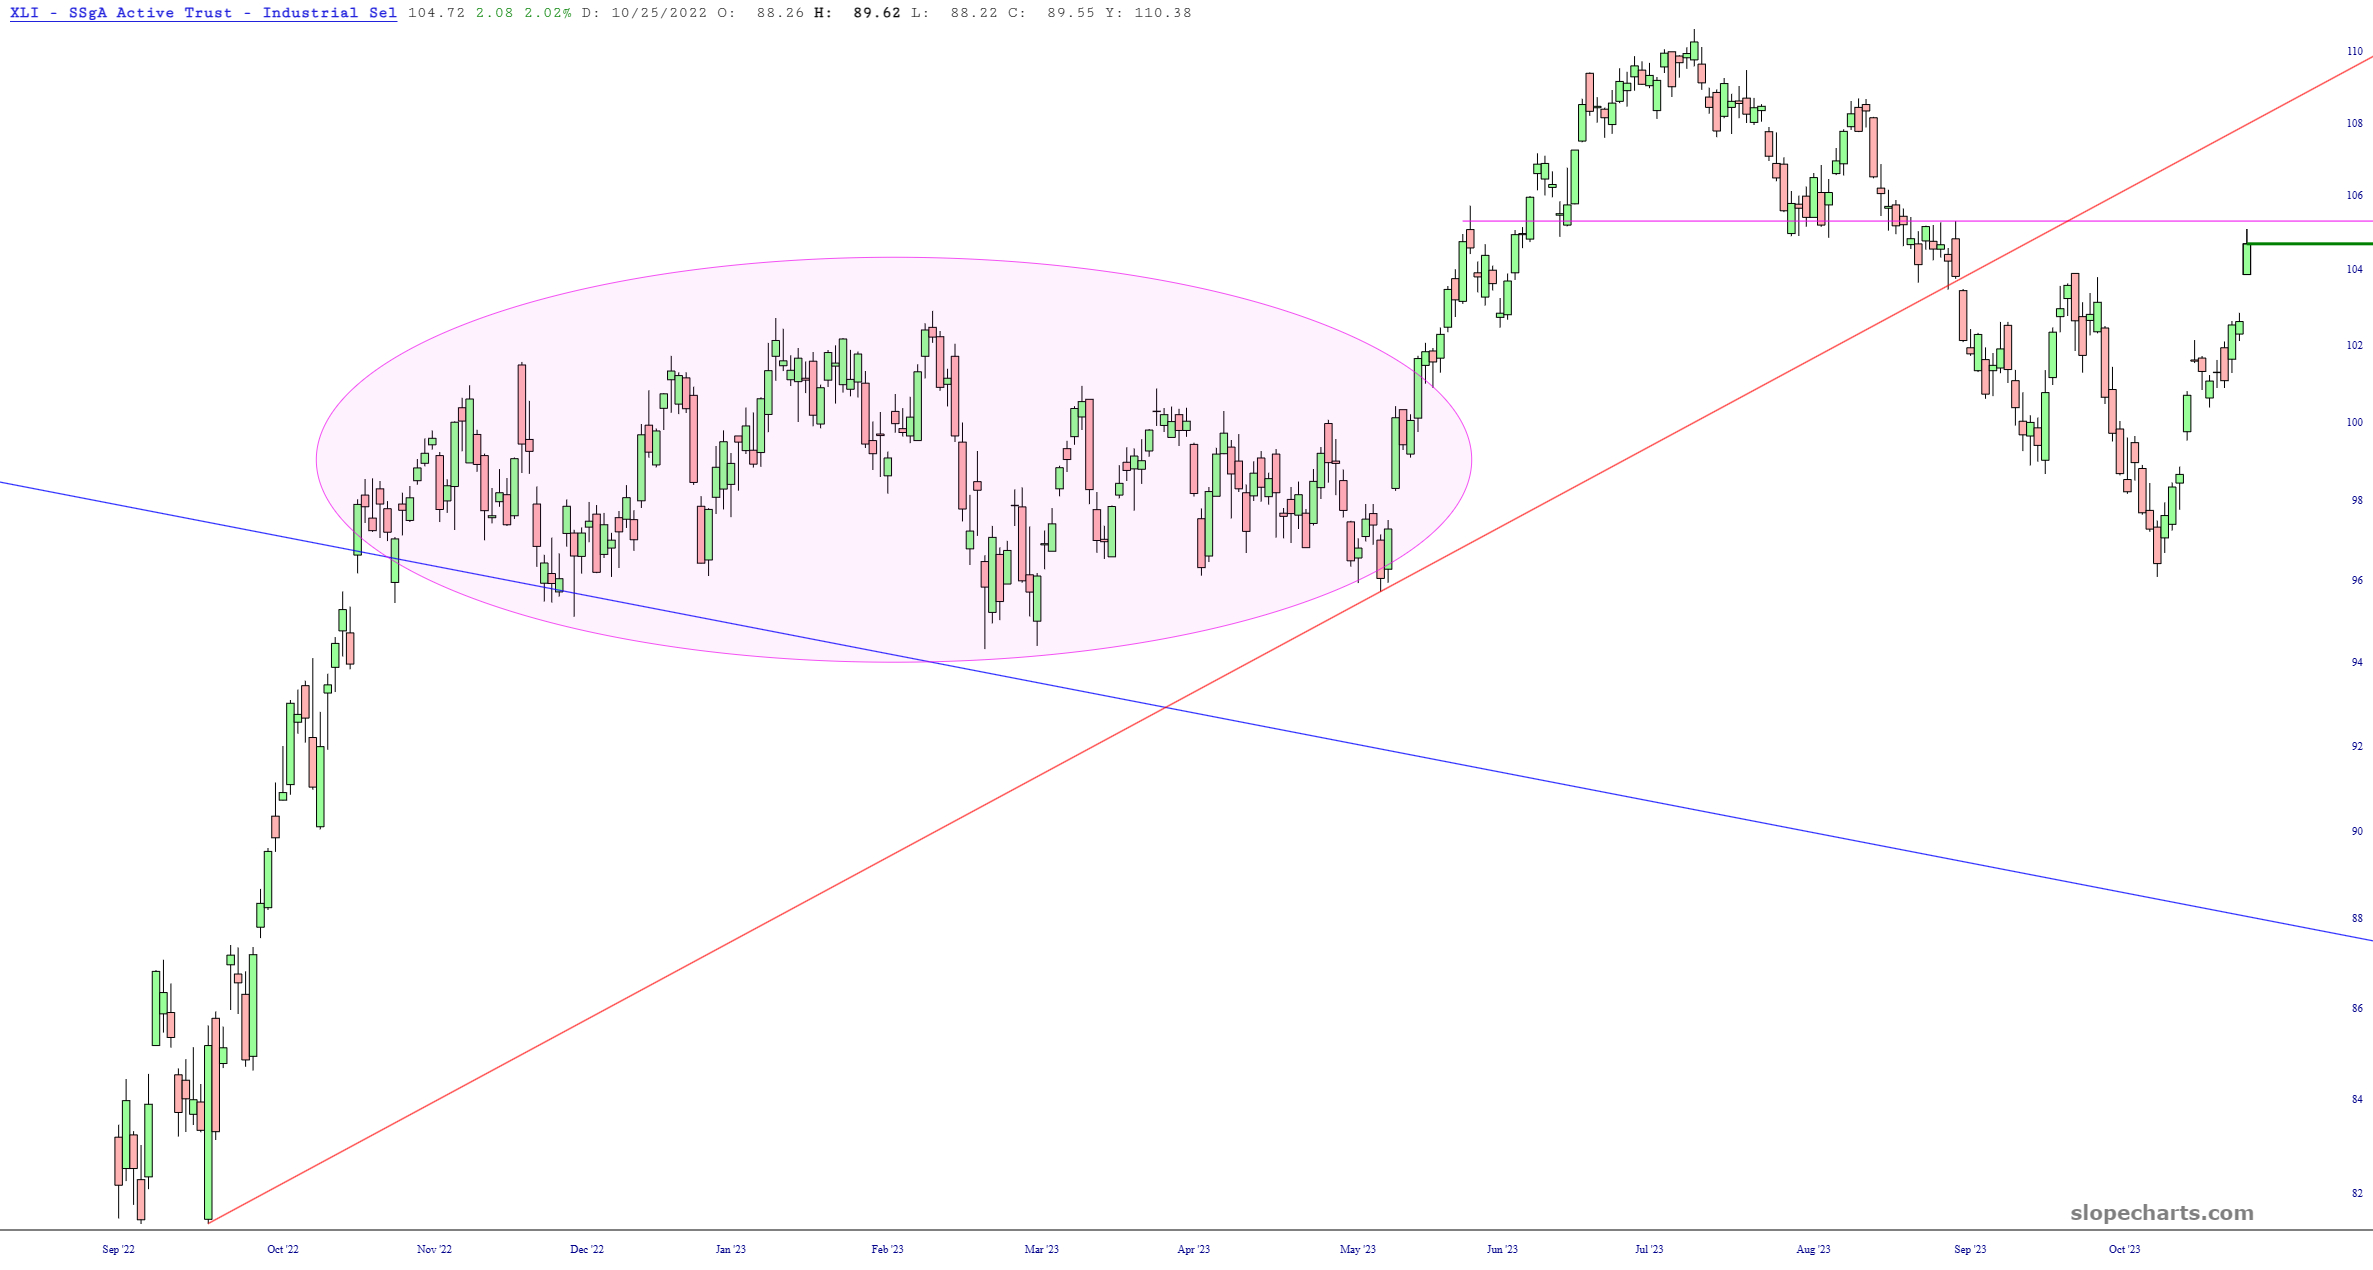
The less well-known “industrials” fund, XLI, is getting very clsoe to its own horizontal, this one constituted the base of an inverted cup-with-handle pattern that preceded the powerful sell-off earlier this year.
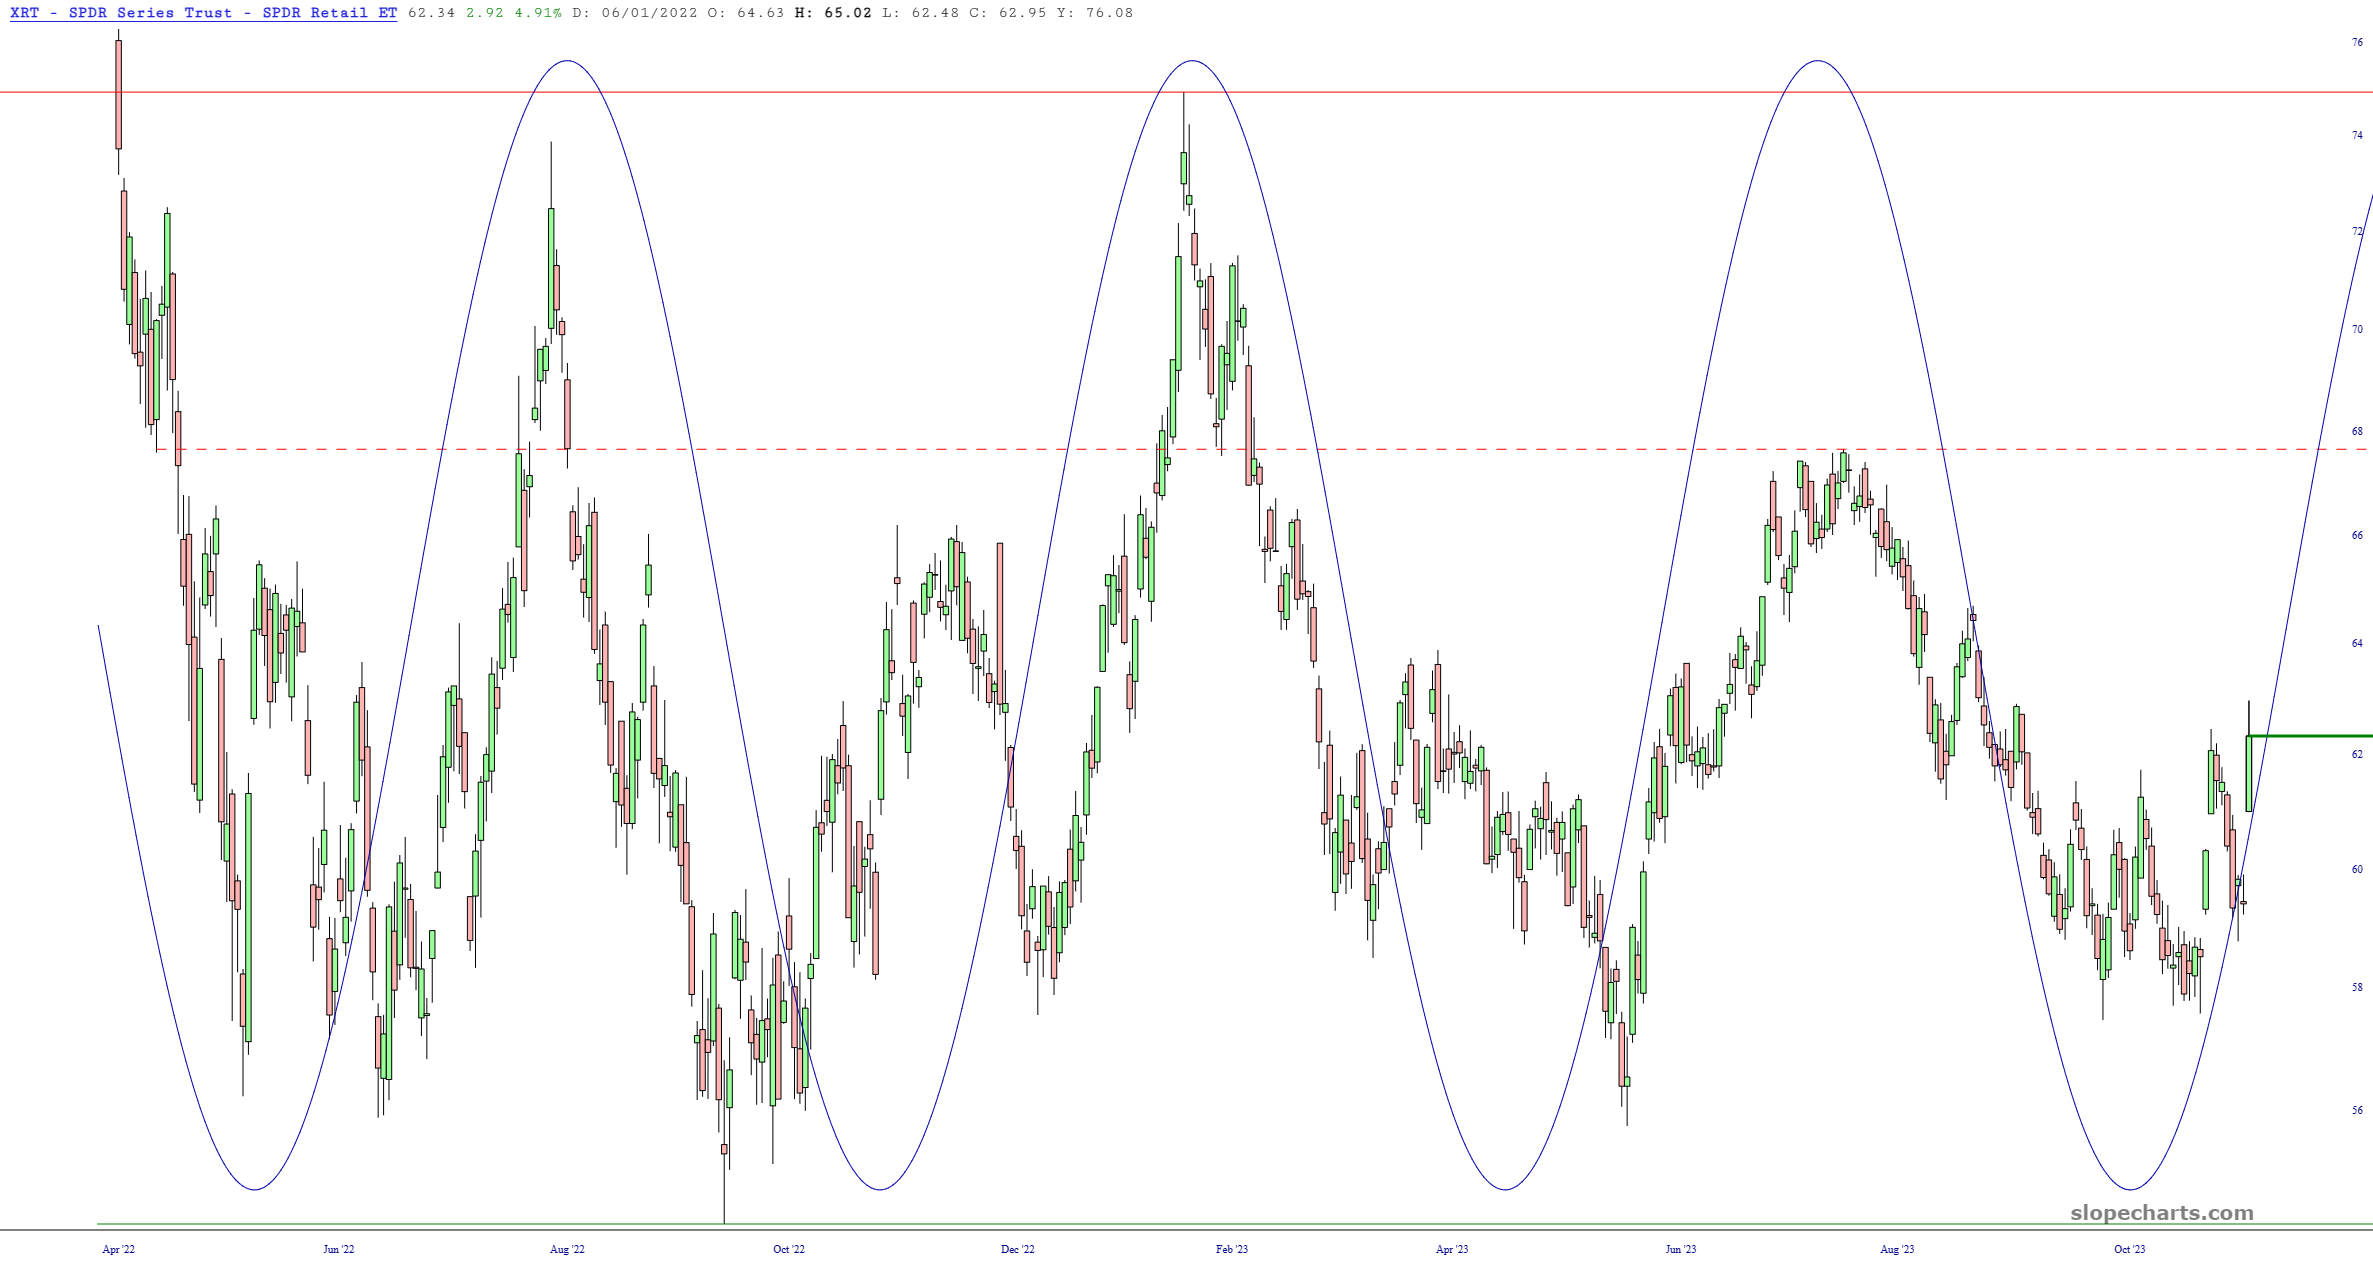
On a bullish note, the retail fund has been following a sinewave pattern with rare regularity, and its especially large leap on Tuesday is indicative of how the gravitational pull of the present position in the sinewave cycle indicates just how much sway this “pulse” has on prices.
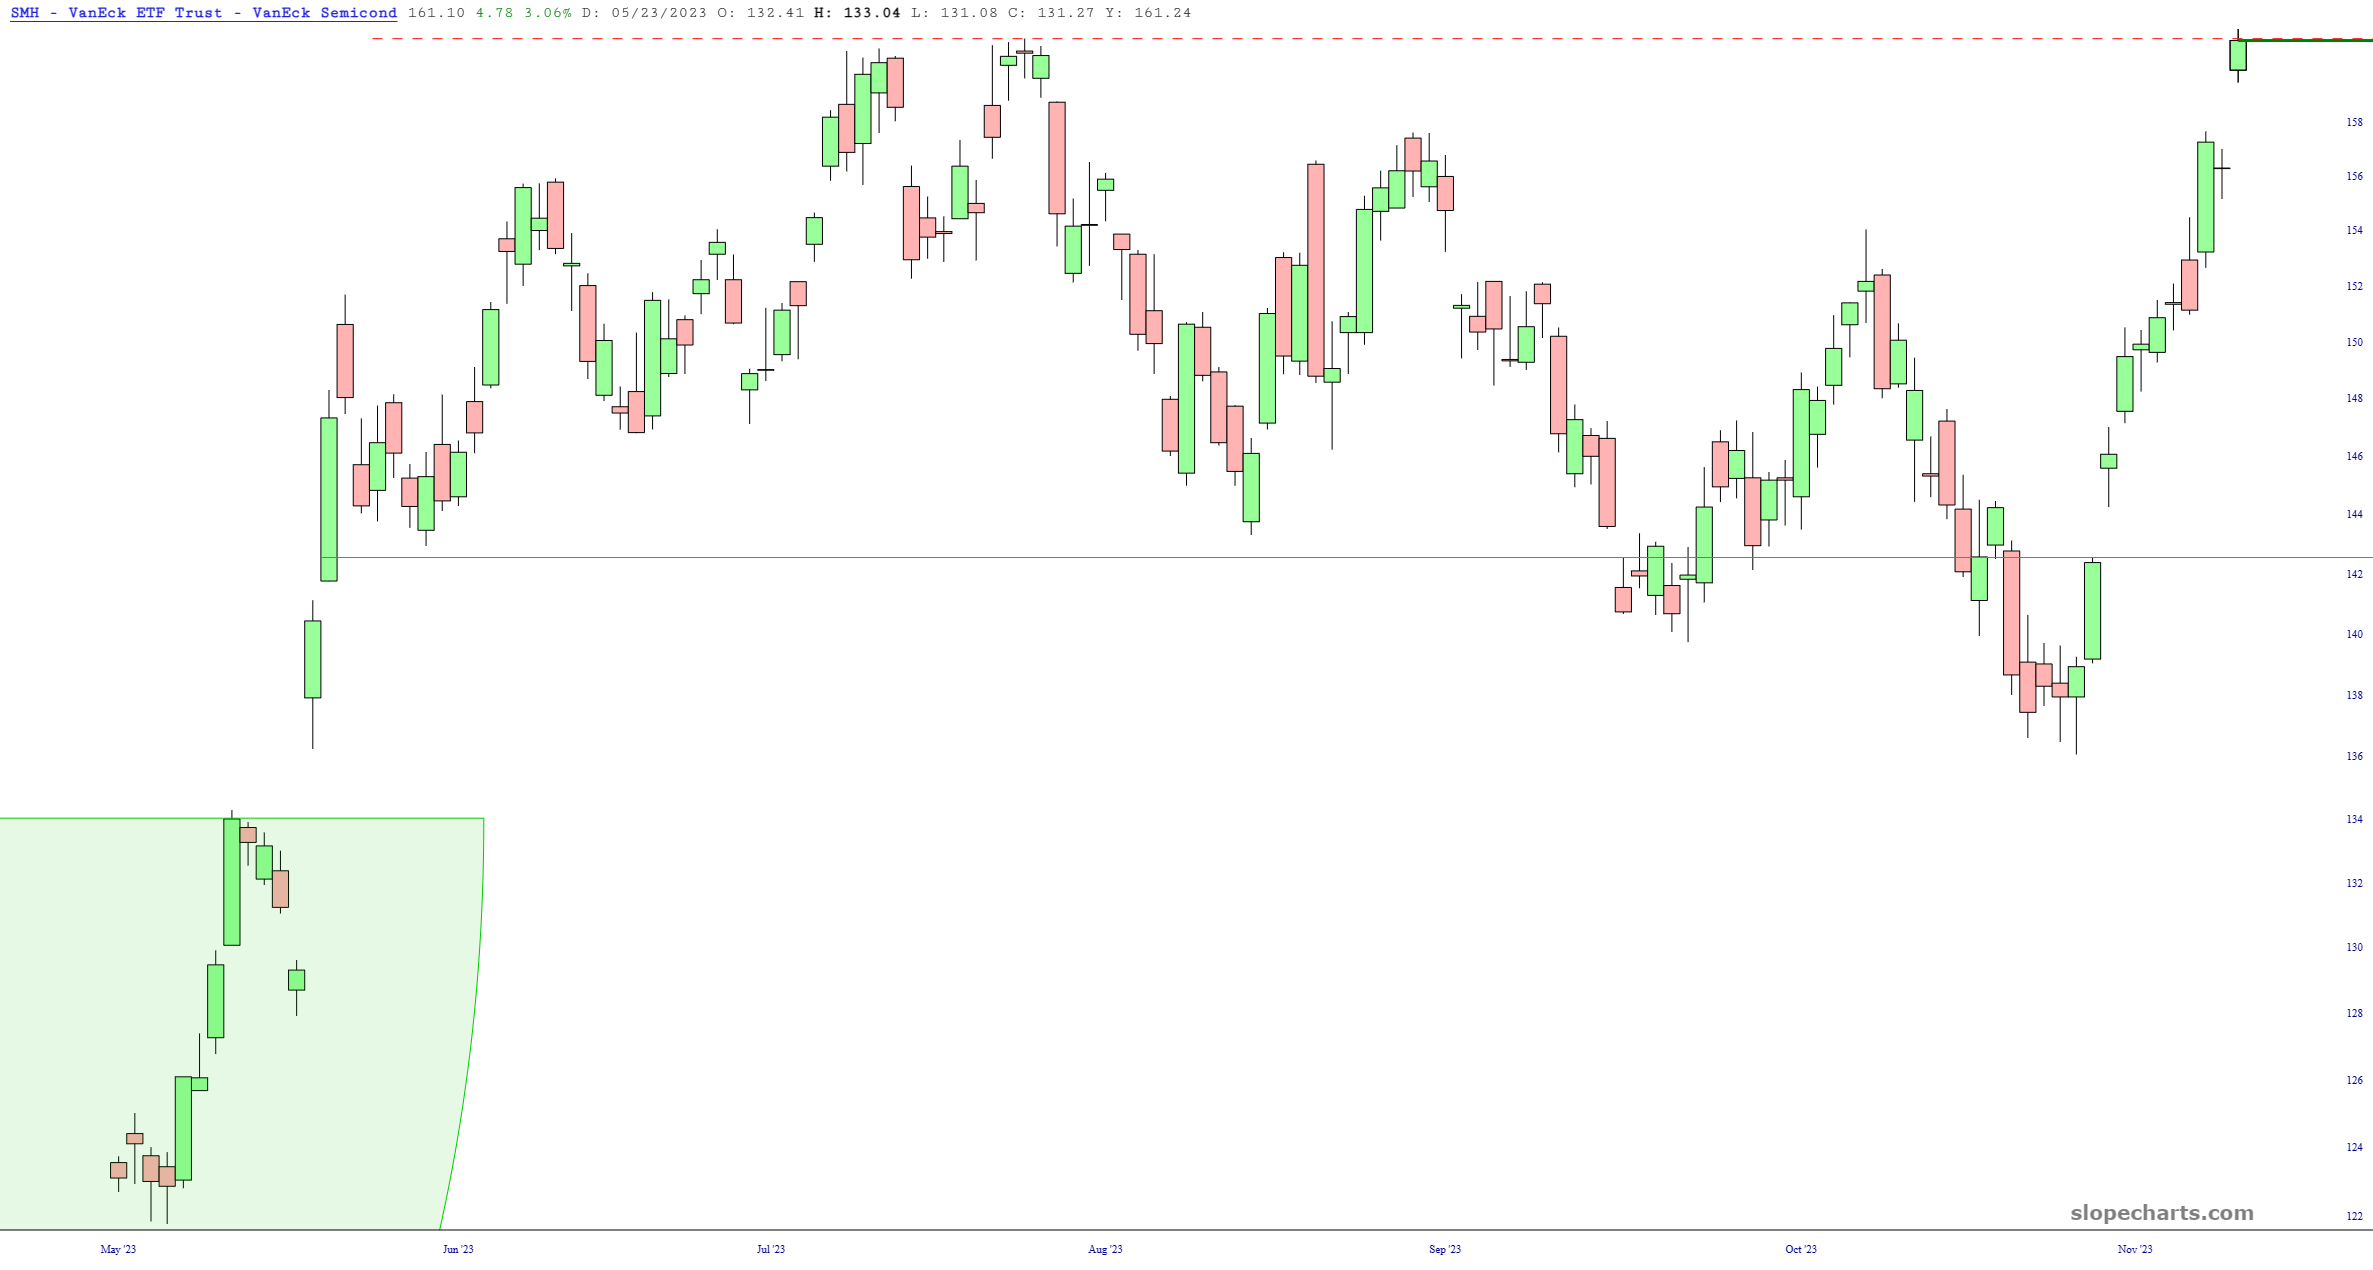
Finally, the semiconductor index reached the highest point in human history, led, as always, by NVidia. It took many months for the semiconductors to slip from the top of the range to a new low, but it took a couple of weeks to completely undo all that damage. The key question at this point is whether semiconductors will fault above the range to more new highs. The key decision point for this is what happens with NVDA next Tuesday after the close, when they report earnings (and event that, in spite of representing just one company out of thousands, will probably move the entire market the following day).