
Something I’ve been noting over the past few weeks is the steadily rising Equity Put/Call Ratio 10MA. As a signal alone, a CPCE near its upper weekly Bollinger is one of the better breadth conditions I have found that can put me on alert to buy when the main DTL is breached. The vast majority of the time, Equity PCR rises during a pullback or correction, but it very rarely gets near the upper weekly bollinger when price has not pulled back a few percentage points first. In fact, in all the data I could view back to 2004, it has only happened five times. These occurrences have a few characteristics in common.
- High numbers of stocks that are trading above their 200 day MA’s
- Tends to follow some kind of extended run up.
After the S&P500 has had a good run, it’s only natural to start thinking that price has come so far that it’s getting a bit long in the tooth and perhaps a correction is right around the corner. The problem is that when too many traders and investors start considering hedging their bets and putting on some put protection most of you know what happens when there are too many leaning towards one opinion. Of course, it has a lower probability of happening. Especially when you consider these hedges decaying and keeping a passive bid under SPX where most hedging occurs.
Below I have charts of these high CPCE occurrences and have highlighted in blue the date zones when the % of stocks above their 200MA’s were greater than 75%. I have also included the Bullish Percent Index at the time with strong market zone highlighted green to show whether the broad SPX was in a strong or vulnerable condition when the high CPCE with SPX at highs occurred. Bold upward-facing arrows locate the occurrence(s) in the chart.
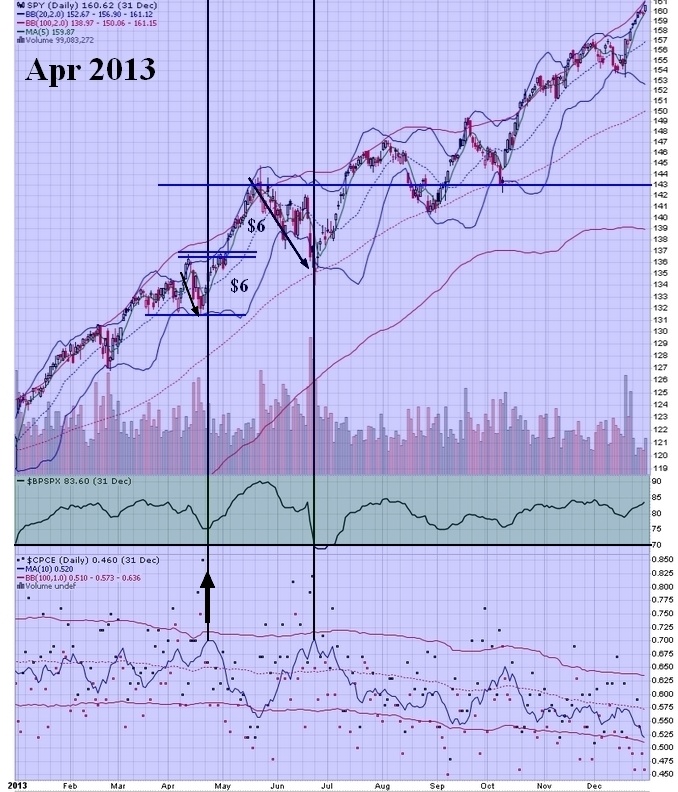
In 2013, price had had a strong move through the first quarter and identically to 2021 followed an election year. Additionally, the entire year had greater than 75% of stocks above their 200MA’s. Price-wise, in this case, there was a small pullback in mid-April that caused the 10MA to rise (and it will lag a bit being a 10 day average), but price was very quickly back at the highs and stalled a few days before breaking out. I noticed that as now, there was a day or two where it may have appeared that SPX might have been about to form a H&S pattern, but that was quickly negated as price reached the previous high. Once it broke out, it doubled the range (and CPCE dove below the lower W-BB) before rolling over into a true corrective pullback.
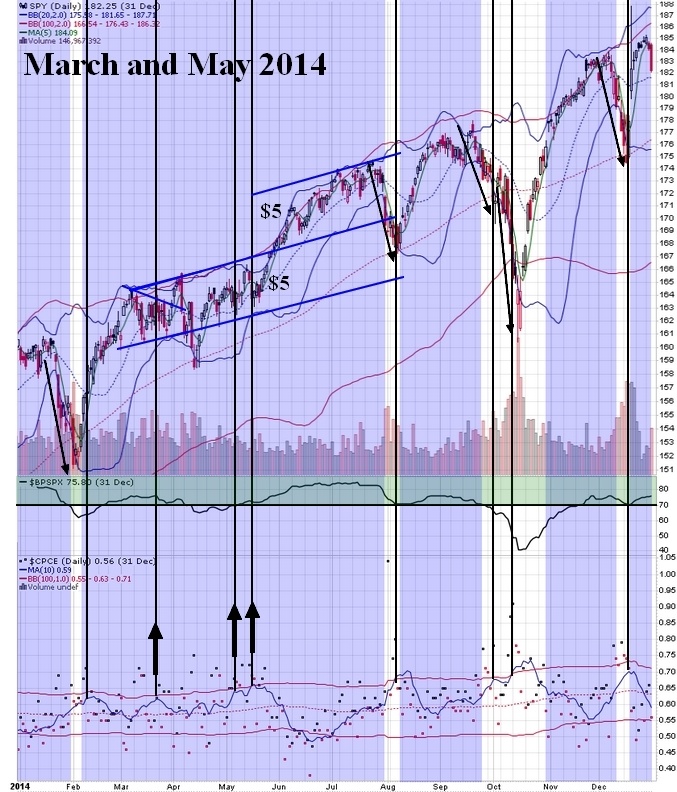
In 2014, again, the percentage of stocks remained greater than 75% for most of the year. In this case, SPX did have a 1Q corrective pullback which V-bottomed and took off like a rocket. In March, there was a Symmetrical Triangle formation that broke out to form a channel (wedges become channels at least briefly). It then corrected back to the 100MA where it found a bottom after which the high CPCE occurrence reoccurred (like it has in 2021). This time, price broke through the upper channel line, then retested and held, before doubling the range. I find this works the same as a flat-based range doubling. You just measure the width of the channel and double it and that gives you a pretty reliable initial price target. Again, after doubling the range and a steep drop in CPCE, a corrective phase unfolded.
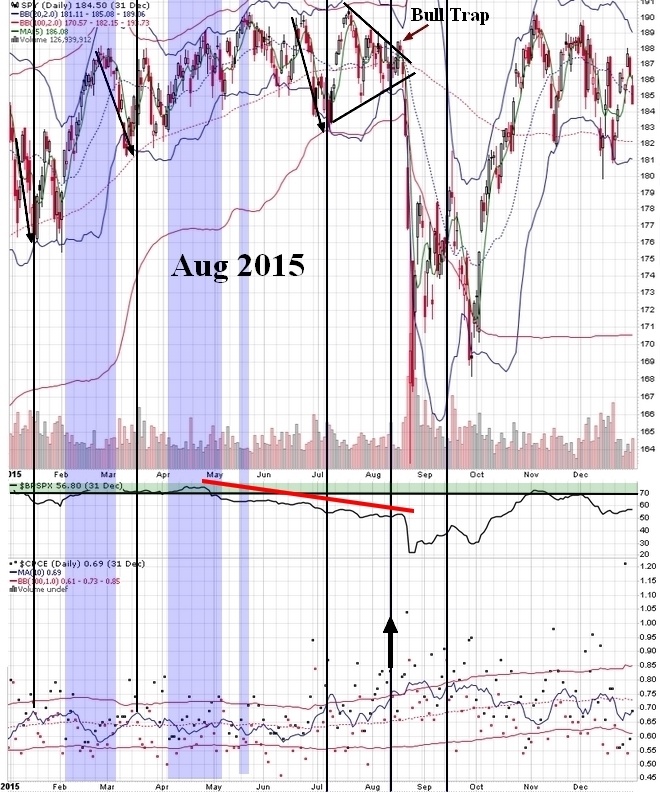
2015 was a different story. This time, QE was heading towards its end and the BPI had been showing signs that more and more stocks were making lower lows. Reflecting this, the percentage of stocks above their 200MA’s had also dropped below the 75% level (it was around 60ish in August before the breakdown). Again, price formed a Symmetrical Triangle pattern denoting a pause and potential reversal in trend. In this case, price broke out, but ultimately proved to be a bull trap that delivered ludicrously fast price depreciation.

(Note that this chart starts in July 2016) In 2017, and again following an election year, the percentage of stocks above their 200MA crossed above 75% again after a monster rally out of the election low (and oh look, pullbacks in Sept and Oct into a November 2016 low, look familiar?). Here the high CPCE occurred in February 2017, truly at the highs and having established a channel trading range already. Price broke through, then retested and held, before doubling the range. CPCE made it about halfway back to the WBB low, then there was a brief pop over the measured move target that was quickly given back into a corrective phase.
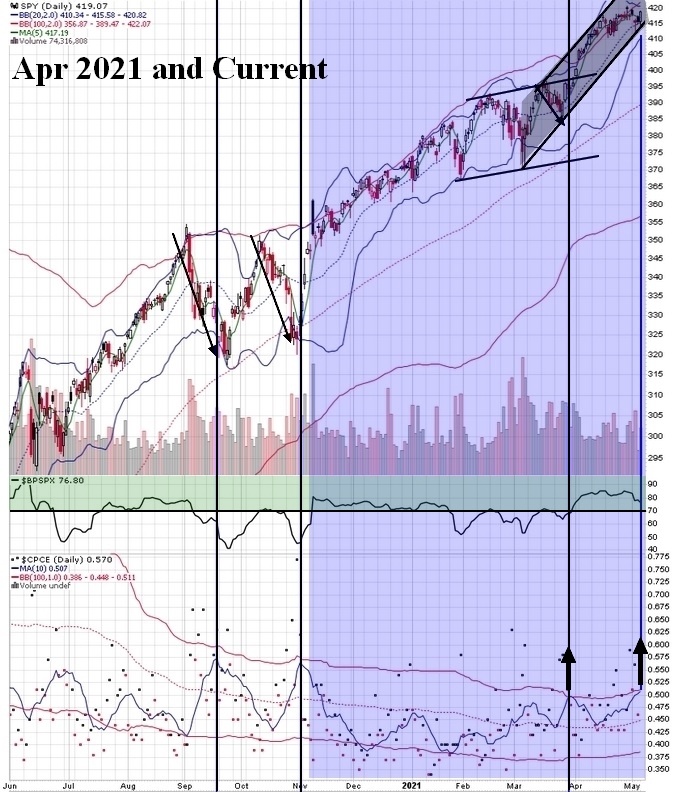
And finally we come to 2021 (chart starts in Jun 2020). Here, as in 2013 and 2017, 2021 followed an election year and the percentage of stocks above their 200MA’s once again crossed above 75% (I’m sensing a theme here, are you?) In early April, CPCE was high again with price at ATH’s. This time it was a $25 channel range. After breaking out and holding the retest, price has had a quick $23 rally. It would appear that if price can break out again from the doubled channel high, price could perhaps run another $20-25 into the $440-450 levels. CPCE’s 10MA dropped back to the 100MA and SPX saw only a small pullback, twice, which as of Thursday’s close had the potential appearance of a H&S pattern which has now been negated. Similar to other years, there was a brief consolidation zone that made a potentially bearish pattern that then broke out bullishly.
The question now is, will price follow the other bullish patterns and break out again for a first ever channel tripling? Or will, price hold the resistance and all hell break loose? I don’t know, but breadth and price will be my guide. Given the other examples, I am leaning bullish here with the tailwind of strong breadth and money-printing on top of it. Ideally, I would like to see CPCE drop to an absurdly low level. If that happens, I think there will be a strong setup for an actual corrective phase. As things stand (and drawn in on the chart), 2021 has established a bullish channel that has now had a strong bounce off of the lower channel line. I am watching for a hit of the upper grey channel as a sign to take at least half profits and tread more carefully.
Concluding notes:
- In all of the bullish outcomes, the weekly upper bollinger was NOT solid resistance.
2. 3 of the 4 bullish outcomes rallied with CPCE dropping lower and then corrected (except Apr 2021, so far…)
3. All of the bullish outcomes had a high percentage of stocks above their 200MA’s and the BPI in the >70 strong market zone. The one example with weak breadth got kicked down the stairs.
4. 3 of the 4 followed election years.
5. The further CPCE dropped after the bullish breakouts, the worse the corrective measure afterwards.
6, Don’t mess with the post-election years! Good luck this week!
