
Greetings from Revolution HQ in sunny Tennessee. I must say the first half of this year has flown by. It seems like just a moment ago I wrote “A Revolutionary 2021” to give my thoughts on the upcoming year. As we prepare to head into what should be an exciting second half of the year, I wanted to take a moment to examine what I’ll be on the lookout for.
Let’s begin with the broader market, and then I’ll work my way into some of the other sectors that I am involved in. Looking at the past year on /ES we can see that after a bit of consolidation last fall, we have been on a simple, steady ascent higher since. Thus far 2021 has been a series of higher highs, and higher lows. Do I believe that is going to change at any point this year? Yes, but not yet.
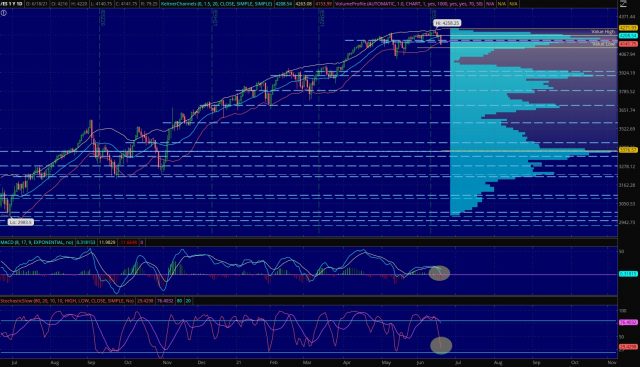
Looking at the daily /ES chart above, I want to start by pointing out a few things. First, the selling we saw last week has left the market in a short term oversold condition. You can see that in price piercing the bottom Keltner channel band, as well as stochastics gettings to an oversold level. MACD also remains in positive territory, but has fallen down to almost touching the zero line. Thus far in 2021, these conditions have not lasted long before the next thrust higher begins.
Let’s also take a look at value high and low for the month. /ES broke under value high on Wednesday of last week. This is a high probability signal that price will fall all the way back down to value low before the month is out. The only thing that gave me pause for that scenario playing out were the two POCs sitting right in the middle of the value area. Price was respecting the POCs until the close on Friday.
So heading into this week I am most interested to see how price reacts for the remainder of June around value high and value low. My assumption is that value low may be tested briefly, and then we will begin the next leg higher in /ES. If you are long, value low is where stops should be placed. If you are waiting to get long, buying value low is an excellent choice. Waiting to buy a breakout of value high would be another good entry.
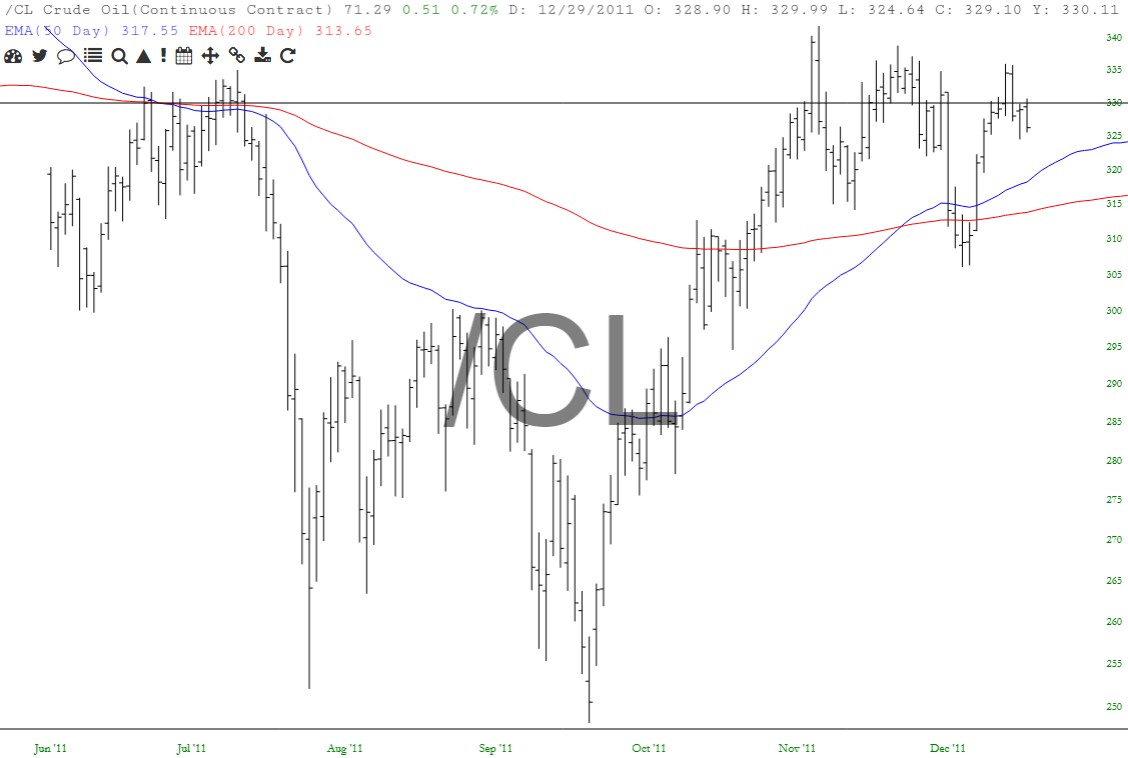
Next, attempting to forecast /ES for the remainder of the year, let’s look at the above chart of /CL for the second half of 2011. This is the “10 year crude oil to /ES” analog that Tom McClellan noticed years ago. Looking at the analog, a rise in July is forecasted, followed by declines in August and September, and then ends the year with a rise from October thru December.
I believe the declines in August and September will be our large correction for this year. This analog does not give clues about the magnitude of the drop to be expected, only timing and turns. I will say there are other tools that Tom uses that are also looking for a drop around this time. You’ll have to sign up for his service or follow him on Twitter to get a look at those.
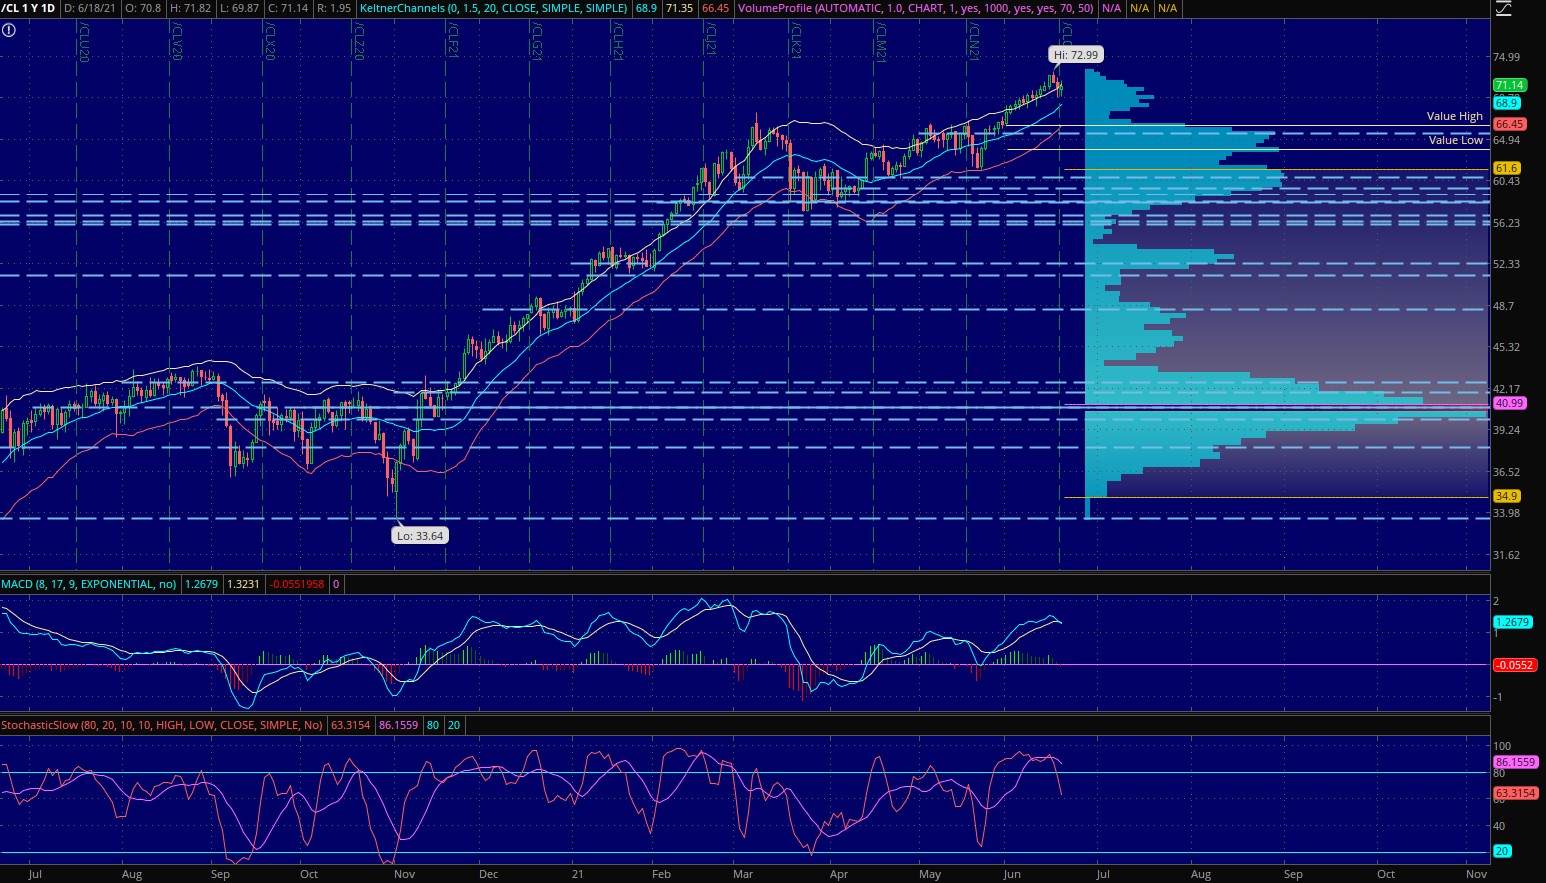
Next, let’s have a look at the energy sector. As you know this has been my largest area of focus for this year. Below is the daily chart of /CL for the past year. Thus far, /CL has also been on a steady ascent this year. Our only period of consolidation came in March. During the March correction what gave me confidence in holding long was that in February /CL had broken above a cluster of six POCs between 56-59. That was a major sea change in the /CL chart, and it will be very difficult for price to break back under that cluster of POCs. The March correction found support around the 58 level, and has been back to rising ever since.
So where is /CL heading for the remainder of 2021? Another analog that Tom McClellan utilizes is the “/GC to /CL” analog. Historically there has been about a 20 month lag time in this analog. This means that what /GC was doing 20 months ago should now be echoed in the price of /CL. Below is a chart of what this analog is forecasting for how /CL “ought” to act during the next nine months.
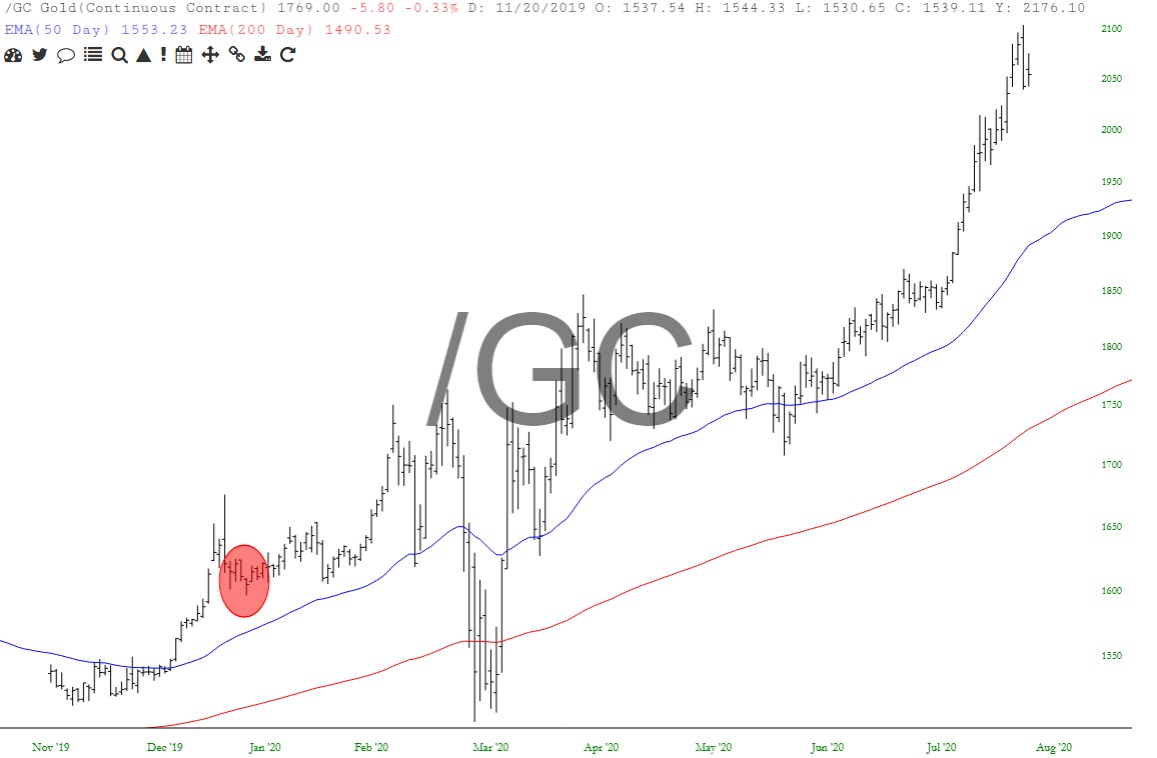
I will say interpretation of where we are in this analog is up for debate at the moment. It is my belief that this analog is running a bit ahead of schedule at the moment due to QE and demand for energy coming out of the Covid crash as the economy gets back on its feet. I have circled on the chart where I believe we are at the moment.
This interpretation fits well, I believe, with how I expect the broader market to react during the rest of this year. Looking at the daily chart of /CL, oil hasn’t corrected this month as much as /ES has. /CL remains a bit extended to the upside this month, and is subject to further consolidation before taking another leg higher. The analog is calling for another few weeks of sideways consolidation, then another strong rise into what should be an August/September top along with the broader market.
If we indeed see a strong correction in /ES during the August/September timeframe, /CL will likely sell off along with the broader market. As you can see from the analog though, the bottom coming off of that correction should be an amazing buying opportunity. Price is forecasted to rise powerfully from a September bottom to a spring 2022 top.
To sum up my strategy for /ES and /CL for the remainder of 2021. I will be looking take profits and sell into any noticeable strength in July and August. I will then be looking to participate in the downside during a forecasted August/September correction. Finally, I will be looking to get back to fully long stocks in late September after the market has corrected.
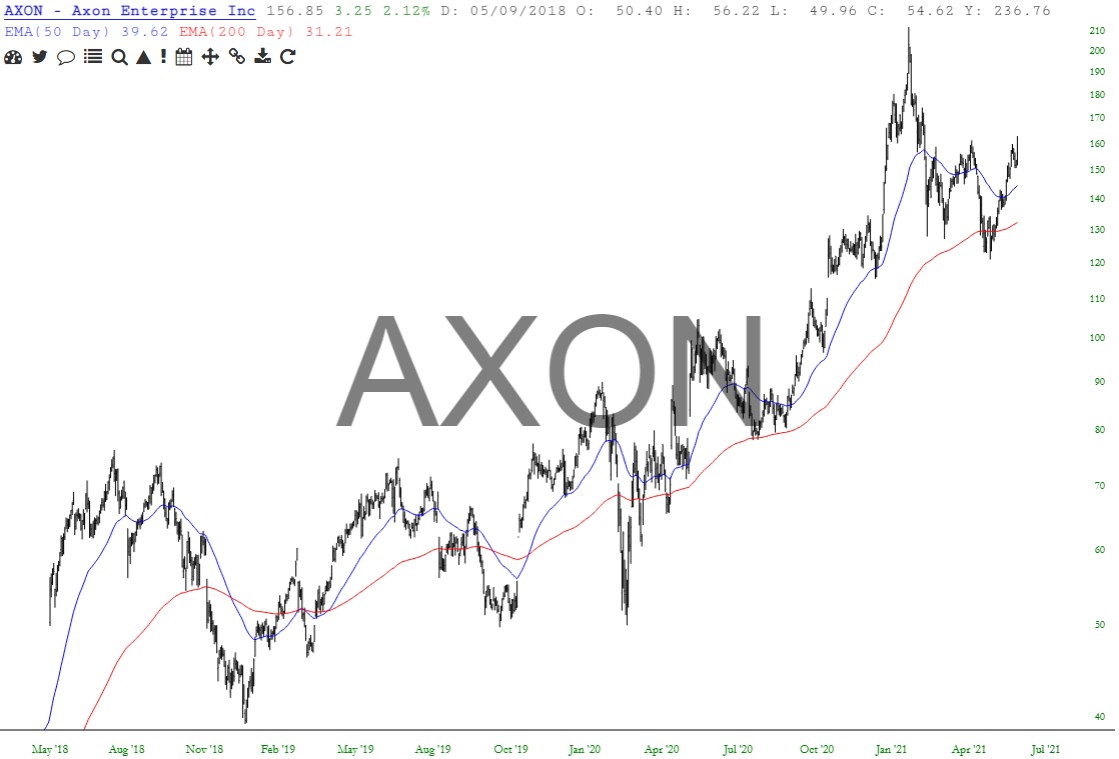
I will leave you all with one final nugget. Axon has been a long time holding of mine, and one of my preferred stocks to own for the long term.
The stock had a monster start to 2021, nearly doubling in the first six weeks of the year. I will bring your attention to a couple points in the chart above. This is a three year daily chart of AXON. Coming off the 2018 correction, the stock has gone from 40 to 212. Looking at the chart, I would suggest AXON is in the midst of a parabolic move higher. The rapid start to 2021 led to a large correction which consolidated all of 2021’s gains. The area it found support at is bullish in my opinion. It found support at the same level it consolidated at in the final two months of 2020. If this area had been broken, the chart would have looked much different.
The correction in AXON is now over, and the stock is back to moving higher. While this stock is susceptible to broader market weakness, I expect AXON to be breaking out to new highs before the year is over. Happy hunting for the rest of 2021!
