
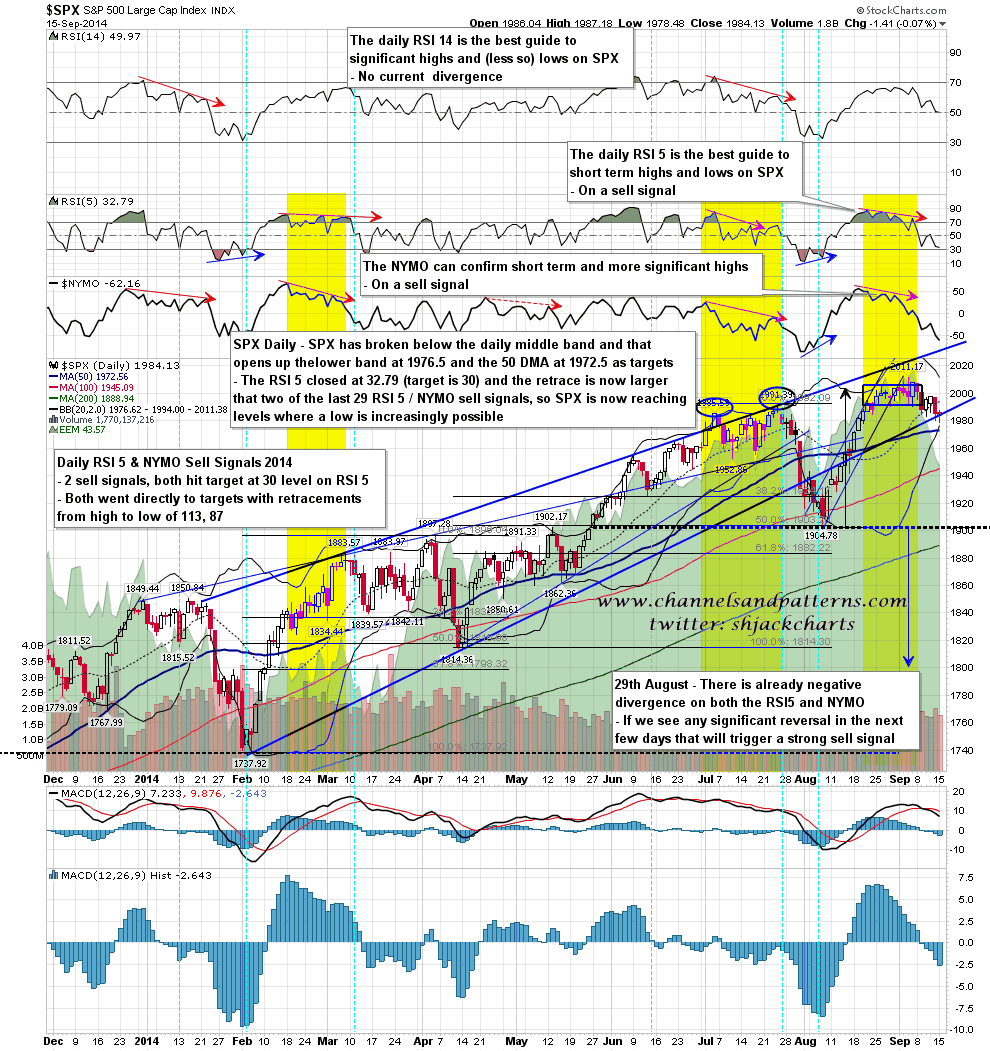
The SPX daily RSI 5 closed at 32.79 yesterday, and the retracement is now larger than two of the past 29 signals since the start of 2007. SPX has reached a level where a low wouldn’t be an extreme statistical outlier. This isn’t a false signal that is part of a larger sell signal forming however, so once I strip out the four of those, then 20 of the remaining 25 signals made it to the target level at 30 on the RSI 5. This retracement may well make it there as well.
There is something else to consider as well. SPX has broken below the daily middle band, and confirmed that break by holding below it yesterday. When this happens then there will be a test, most of the time, of either the daily lower band, or a significant moving average. My eye is drawn to the daily lower band at 1976.62, and the 50 DMA at 1972.56. Both of these are decent targets for any further move down. SPX daily chart:
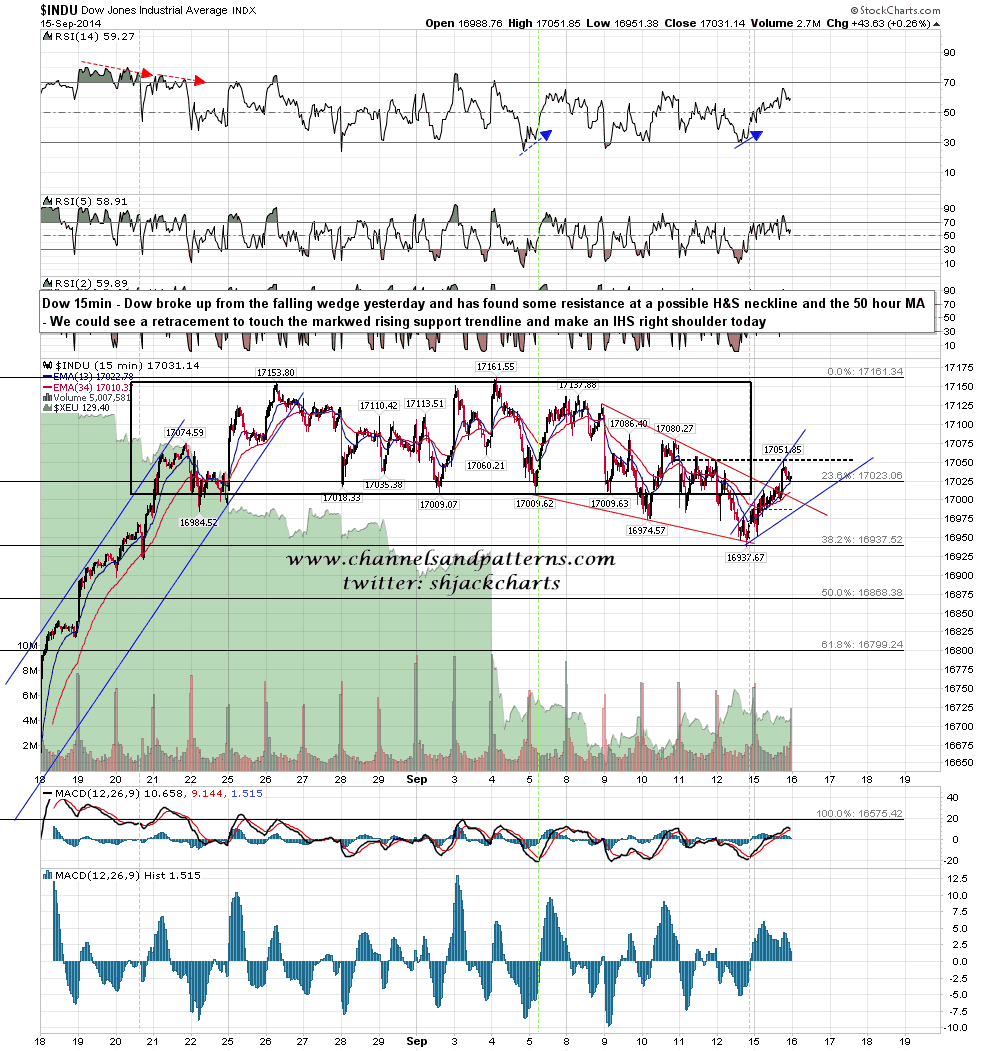
The falling wedge I posted on Dow on Friday broke up yesterday. An IHS may be forming and I’ll be watching to see how that develops today. INDU 15min chart:
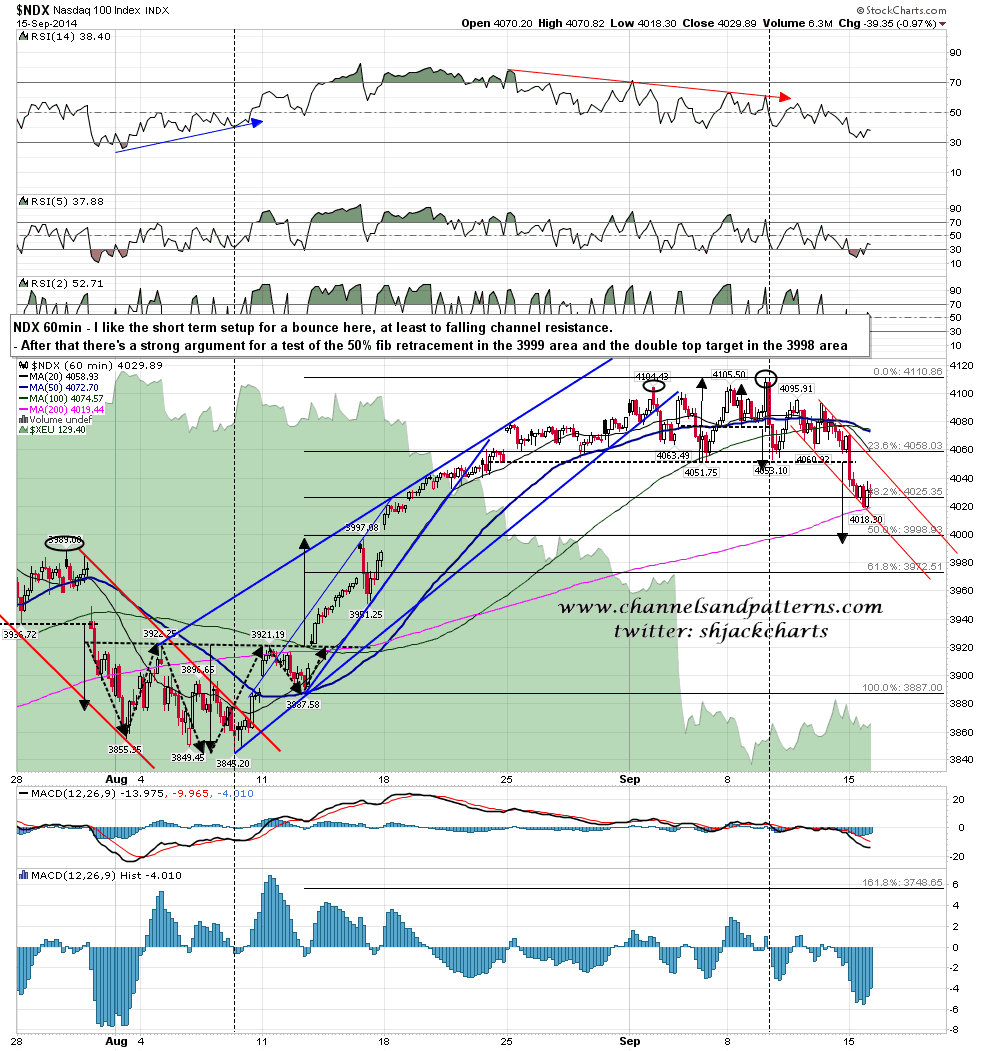
NDX was very weak yesterday and, significantly, broke down from a double top with a target in the 3998 area. Big round numbers tend to be price magnets and the 50% fib retrace level is at 3999, so the odds of a hit there look pretty good. Short term I’m looking for a bounce into channel resistance. NDX 60min chart:
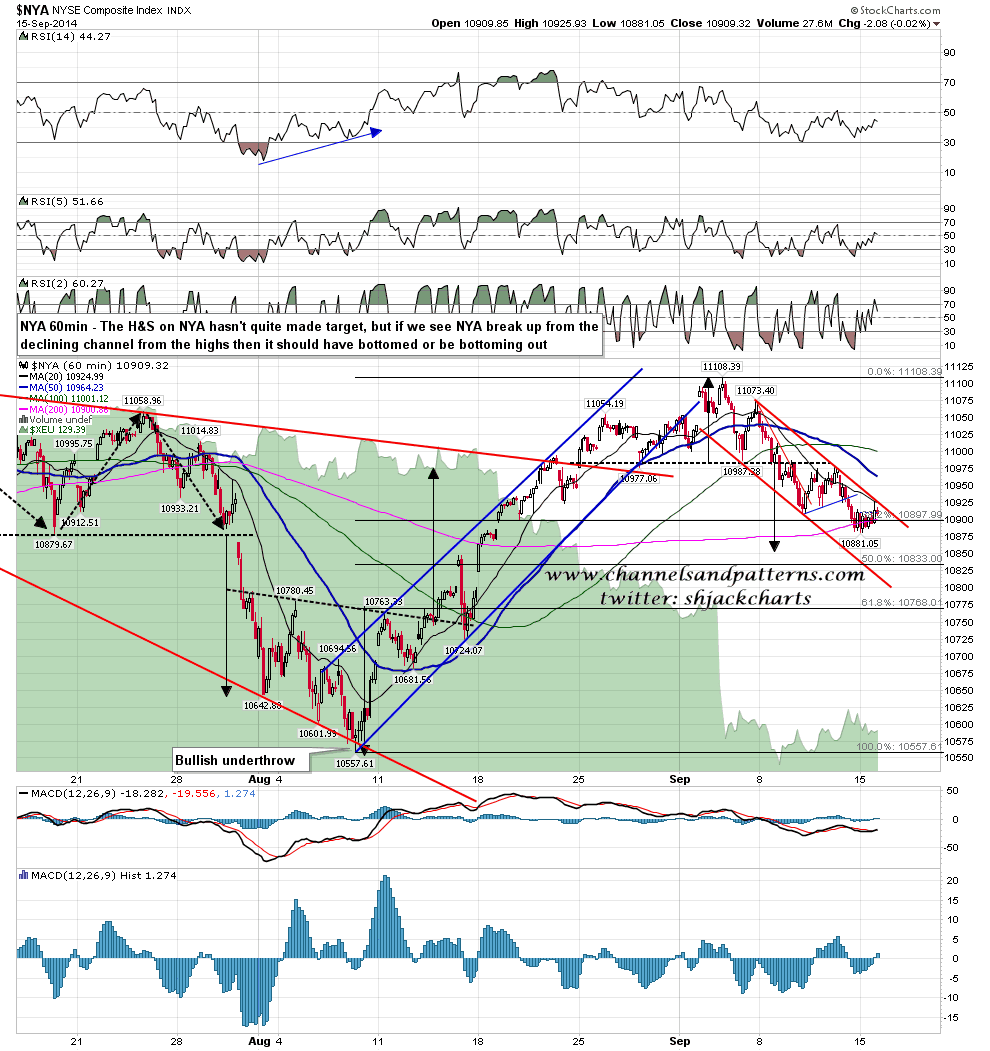
The setup on NYA looks very similar to the setup on NDX. Same open double top target near the 50% fib retrace level, same falling channel. That strengthens the case for some more downside on these two at least. NYA 60min chart:
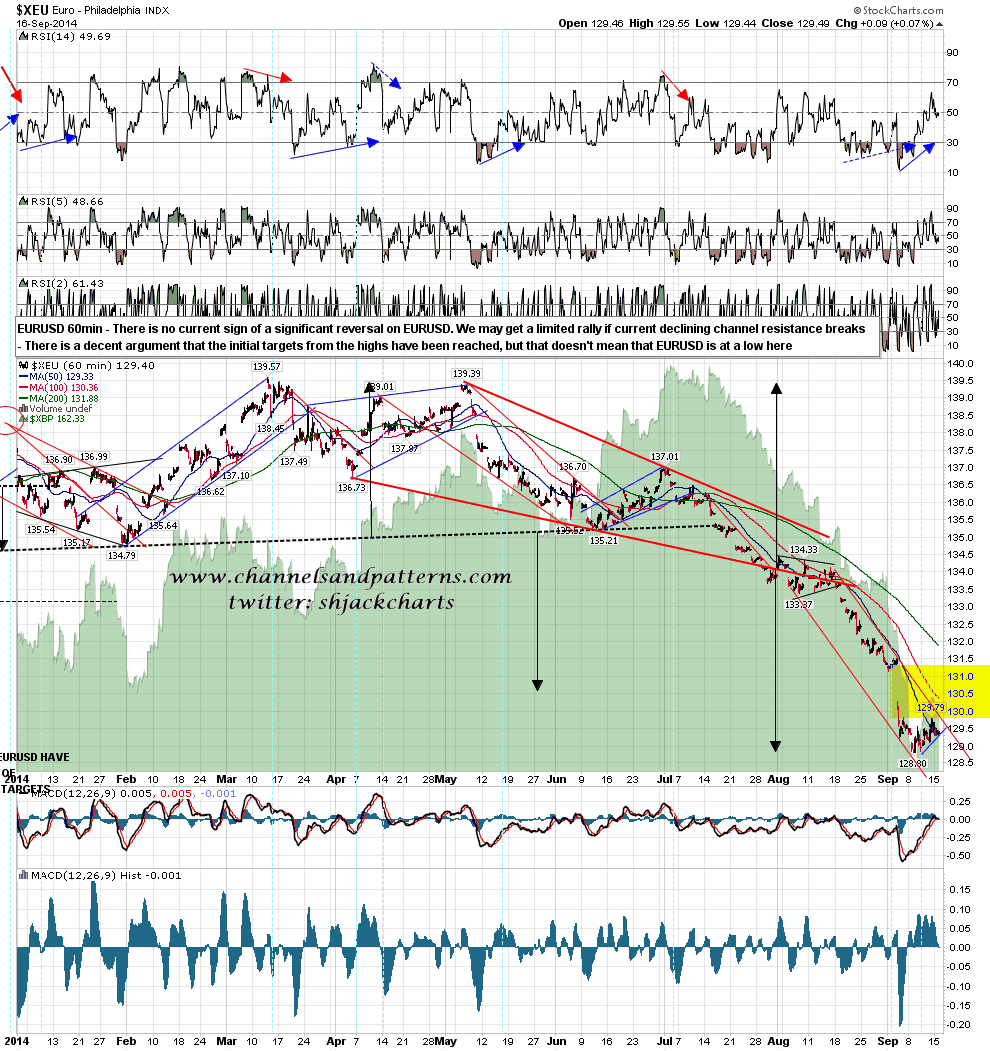
I’ve been considering the case for a bounce on EURUSD carefully. There is a strong argument that the initial targets from the topping patterns, H&S and falling wedge, have been reached, and the daily RSI 14 is impressively oversold. I’m watching the current falling channel, and the consolidation at the recent low which looks like a bear flag but could yet be a small IHS. EURUSD 60min chart:
The odds are that the retracement low, if this is a retracement and not the start of a larger move down, isn’t in yet. I like the odds for a bounce today on SPX, NDX and NYA. That should be a shortable rally followed by a (limited) further move down with the obvious targets in the 4000 area on NDX and the 1972.5 area on SPX.
