Slope of Hope Blog Posts
Slope initially began as a blog, so this is where most of the website’s content resides. Here we have tens of thousands of posts dating back over a decade. These are listed in reverse chronological order. Click on any category icon below to see posts tagged with that particular subject, or click on a word in the category cloud on the right side of the screen for more specific choices.
The Elliott View (by PUG)
OK Bulls and Bears, we are at a very critical juncture here. Taking a look at the SP-500 Weekly Chart with linear price scaling, you can see that the current price (1160) is right at the down sloping trend-line (red) that connects the Oct 2007 high (1575) with the Apr 2010 high (1220). Price has also been bouncing off the up sloping trend-line (black) from the March 2009 low of 667. Notice the “Diamond” Pattern that has formed over the past year from Oct 2009 to Oct 2010. This type of Diamond Pattern in this position can form at “Half-Staff” or be a “Topping” pattern. If its at half-staff, then we can expect another move out of diamond pattern of equal magnitude to the incoming move. The incoming move was 1220-667 = 553. So we can expect a measured move from 1011 + 553 = 1564, which takes the SP-500 back to it’s Oct 2007 high.
For the my primary count to be correct, the SP-500 needs to break through this down sloping (red) trend-line and move towards a new high above 1220 by end of 2010 in major degree wave [1]-P3. From there, the SP-500 will be free to melt up in 5-waves of major degree within Primary Wave 3 (P3) to the old October 2007 high of 1575 over the next two years (see the green path on the weekly chart).
If however, the SP-500 fails to push through the down sloping (red) trend-line in the next few weeks to a month. Then there is a good possibility that Primary Wave 2 (P2) will need to make a deeper correction below 1011. In this case the move from 1220 to 1011 was only major degree [A]-P2 and the subsequent move from 1011 to 1163 was wave [B]-P2. The next move will be a [C]-P2 drop to 954 (if [C]=[A]=209 points) over the next 2 to 3 months. This 954 level would be a 50% retrace of P1 in price and time. I’m calling this my alternate bearish view, in case the SP-500 fails to move higher that this 1163 to 1177 area in the next few weeks to month. If the SP-500 falls to this 954 level for my alternate P2 low, then the P3 move to old high of 1575 will just be delayed by about 3 to 6 months in time (see the red path on the weekly chart).
SP-500 Weekly Chart (10-5-10):
Raging Bulls (by Springheel Jack)
Well that was yet another wipeout for the bears yesterday and resistance at 1150 SPX has now been broken with confidence. That was the last really major resistance level before 1219.80 SPX, though there are less important resistance levels at 1173.57 and 1200 SPX of course.
Looking at the SPX daily chart, we now have a rising channel from the August low, similar to but somewhat wider than the channel established during the spike up after the February low. We also have a shorter term and shallower rising channel established over the last three weeks, and we hit the top of that channel at the high yesterday. We could reverse here, but if we break up through that upper channel trendline, then my next channel target is in the 1180 – 1190 SPX area. A break up looks very possible, as the equivalent channel on ES is being tested hard as I write:

On EURUSD we had a trendline support break yesterday before another move up, and having had a close look at the chart yesterday we appear to have started a reversal process that I have seen a number of times before, most recently at the last GBPUSD low. The process takes the form of evolving though a series of shallower and then reversed channels before retracing. EURUSD may yet break up from this reversal pattern, but if it doesn't then we are close to a top and EURUSD is unlikely to reach 1.40 before the next serious retracement:

The BOJ has been announcing a series of interventions in the last few days and weeks, and one of the main intentions of those interventions is to weaken JPY. There's no sign of that happening as yet and USDJPY is testing the important support level just under 83. Short term USDJPY is in a declining channel:

One of the most popular quotes from the bible, frequently used at weddings particularly, is from St Paul in Corinthians. My favorite part is where Paul tells the corinthians that 'though I bestow all my goods to feed the poor, and though I give my body to be burned, and have not love, it profiteth me nothing'. In essence Paul is telling us that if you don't have love, then bankrupting yourself and committing suicide would be a bad idea. A lifestyle tip worth remembering.
The Bank of Japan clearly feels that it has love, as its strategy of printing endless new fiat money and borrowing vast sums to spend on economic stimulus looks very similar to the bankruptcy and suicide strategy Paul describes. Though this strategy has been pursued by Japan for almost twenty years without much visible result other than an accumulation of government debt approaching 200% of GDP, they have not been discouraged and clearly feel that more of the same is their best path to sustainable prosperity. Good luck to them obviously, and to the many developed countries now following their inspiring example.
For those who don't have confidence in this strategy, for whatever reason, precious metals are looking very attractive as an alternative to fiat money that can't be printed, and they've been on a tear lately. Gold is within a two year old rising channel, and my next upside target is in the 1450 area:

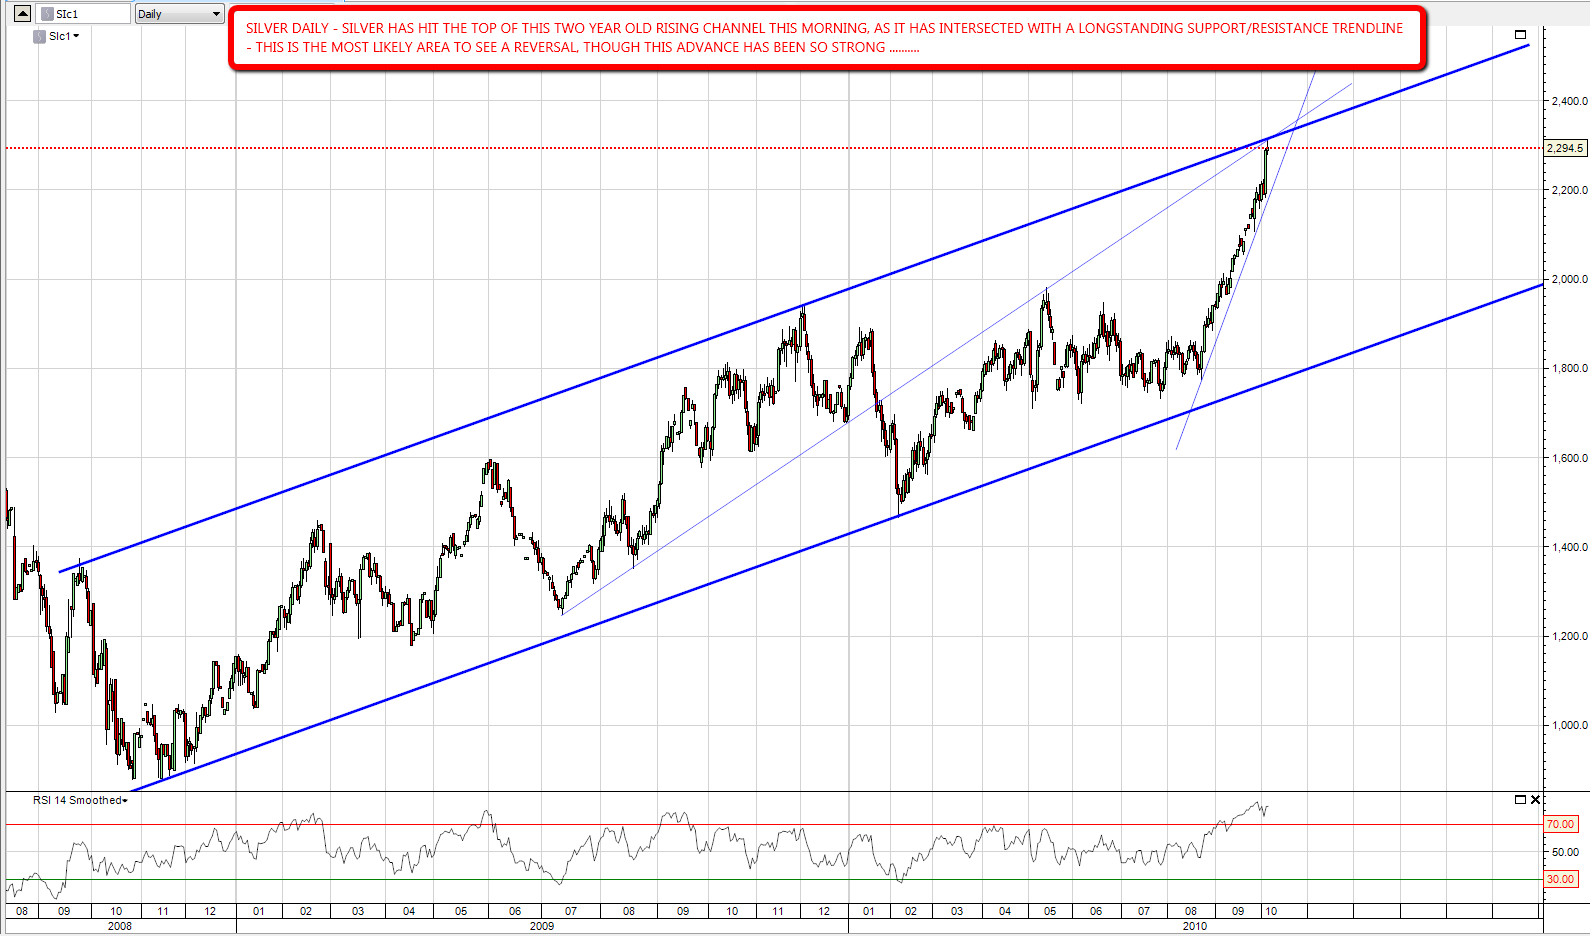
Silver is also within a two year old rising channel, but has been rising much faster so it looks likely that either silver will break up from that channel, or that we are about to see a period of silver underperforming gold. Silver hit the top of the rising channel at 23.09 overnight, and hit it at a point where that upper channel trendline intersected another important support / resistance rising trendline. We could well see silver retrace here, though longer term I am expecting to see it go a lot higher:
A QUESTION FOR ANY CHARTISTS READING THIS:
I'm working on a charting project and I'm looking round for the right software / platform to chart on for it.
What I need to chart is worldwide indices, sectors and stocks centered particularly on Europe, UK & Asia, but also doing emerging markets, US, some commodities and forex though I have good tools for charting the last group other than emerging markets already. I need to be able to do charts for:
- Indices
- Sectors (possibly using sector ETFs)
- Stocks
- I'd also like to be able to create synthetic indicators as I can in stockcharts by dividing one instrument into another. For instance I was posting XLF:$SPX the other day to look at relative performance.
Ideally I need to be able to save several hundred charts in a way that I can review them quickly.
It is something I could do easily in stockcharts if their worldwide range was as good as their US range, but it isn't so I can't use that really.
Has anyone used a platform that I could do this on? TIA. Jack
