Slope of Hope Blog Posts
Slope initially began as a blog, so this is where most of the website’s content resides. Here we have tens of thousands of posts dating back over a decade. These are listed in reverse chronological order. Click on any category icon below to see posts tagged with that particular subject, or click on a word in the category cloud on the right side of the screen for more specific choices.
Adieu JBTFD (by Springheel Jack)
Well the Vix closed up yesterday so there was no Vix buy signal (for equities). So much technical damage was done yesterday in any case that a buy signal here would have to have been treated with extreme skepticism in any case:

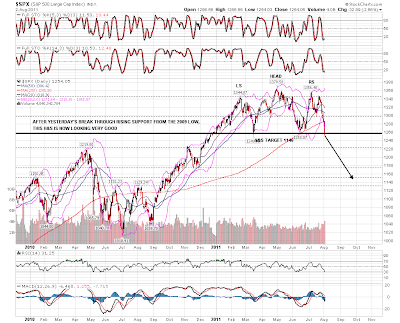
On SPX the rising support trendline from March 2009 was broken with a lot of confidence and the H&S pattern that was forming on SPX has now been completed. If we're going to see a bounce before this H&S starts to play out seriously it will probably be here, at strong support and after an amazing series of down closes that hasn't been matched since 2008. If we see a continuation down then next big support is in the 1220 area:
I've dusted off the larger bear patterns on the other indices and on RUT we have another big H&S with the neckline being tested now. If we see a move down directly from here then I'm seeing the next serious support level at 740. The H&S target is 676:

NDX has been the strongest of these three indices and there is no H&S on NDX as a result. What there is however is a broadening top. I posted this two weeks ago and after some minor tweaks here it is. The next target should be in the 2175 area slightly below the June low:

There was an amazing move up on bonds across the board yesterday and I was surprised and sorry to see my lovely little rising channel on TLT broken. The IHS target I gave at 101.9 has not yet quite been reached:

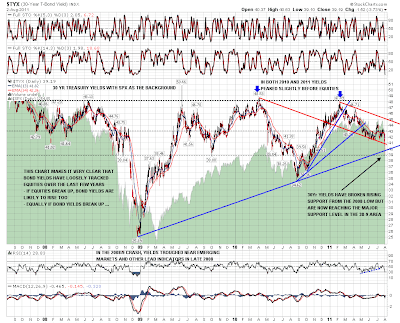
Looking at 30yr Treasury yield on TYX, the move down has broken rising support from the 2008 low but is reaching a longstanding and key support zone in the 38-9 area. If we're going to see a short term reversal, this is the likely place:
There were a lot of broken trendlines yesterday. Another that was broken was my four year resistance trendline for gold. I have a shorter term rising channel with resistance in the 1690 area:

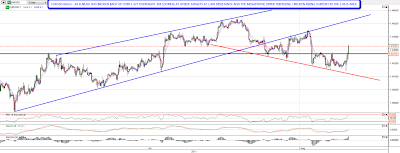
EURUSD has been tricky to call in recent days, but it has broken back up over the key 1.427 level again overnight and I'm looking at two short term upside targets. The first is at at the resistance level at 1.445 where the last move up failed, and the second is at the broken rising support trendline in the 1.4525 area. You can see that since it broke the rising wedge a few days ago it has formed a sort of megaphone:
Massive technical damage was done on equities yesterday, and I think it is more than likely now that the cyclical bull market since March 2009 is over. I had expected this in a year or so, though like many others I wondered aloud how long this cyclical bull market could last in the absence of QE. The answer would now seem to be that it could not be sustained without QE, but failure now leaves the possibility that the Fed might try to turn equities around in the same way they did in 2009, with massive additional money printing. Subject to that, the next few months on equities should be dominated by the bears.
In terms of the immediate outlook eight consecutive down closes on Dow have not been seen since 2008 and major support levels are being hit at the moment. The key level for today is 1257, which was a key level at the June lows. If ES can close an hour above there then I'm expecting a decent bounce here. An important upside target on NQ would then be the 2319 support level I highlighted yesterday morning as a serious warning signal if it was to break.
Behold, I Make All Things New
Videos Later Today
Today was extraordinary, and I have a lot to say about it. I'll probably be doing one – maybe even two – videos about it later today. But for now I'm off for some familial duties. I hope you guys had a great day.
"Now the bankrupt souls of the city are finally tasting defeat" – Elvis Costello/London's Brilliant Parade
Chartwork on Oil (by Mike Paulenoff)
Nearby NYMEX crude oil futures have the right look and the requisite underlying internals to suggest that yesterday's low at 93.42 and this morning's low at 93.81 ended the decline from the July 26 high at 100.62. If that proves to be the case, then as long as 93.75/42 remains intact as key support, oil likely is starting a recovery rally that should revisit key resistance at 98.00-98.60. If hurdled, it will trigger upside continuation to 100.00 for a test of the July highs.
Wouldn't that be perplexing while everyone is fixated on the potentially intensifying global economic slowdown?
Originally published on MPTrader.com.
