Slope of Hope Blog Posts
Slope initially began as a blog, so this is where most of the website’s content resides. Here we have tens of thousands of posts dating back over a decade. These are listed in reverse chronological order. Click on any category icon below to see posts tagged with that particular subject, or click on a word in the category cloud on the right side of the screen for more specific choices.
Reid Between the Lines
OK, well, I was expecting this Debt Ceiling Rally to last a little longer than a few hours. Not that I was long. I didn't have a single long position. But – – seriously – – my view was that our dear, sweet, honest bull friends would rally this crap up to 1330 before Armageddon kicked in. So – – whoopsie. And wow.
Bullish Beginning (by Springheel Jack)
It's the first trading day of the month today, and as I have posted before, that means that the stats today are leaning bullish. With ES up over ten points from Friday's close at the time of writing that doesn't mean that we will see much more upside today though. On ES last week's declining channel has broken up and a reversal IHS may be forming:

On TF last week's declining channel has also broken up and a reversal IHS may be forming:

On NQ last week's falling wedge has broken up and a much less pretty reversal IHS may be forming:
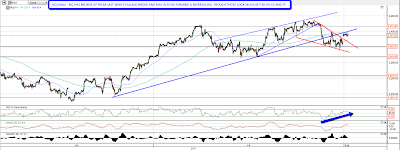
Have we seen the short term low? Obviously there is still some very serious news risk here as the debt ceiling talks may break down again, but SPX held the daily 200 SMA again on Friday and I think there's a very good chance that the low is in. SPX still hasn't reached rising support from the March 2009 low of course:

NYMO is also looking promising here. I was looking at the NYMO chart a couple of weeks ago thinking that was strange that NYMO hadn't reached -80 since the Osama top in May and that was reached last week. That doesn't mean that the last summer low is in but it does mean that we should start looking for it:

Vix is key here as after closing above the daily bollinger bands three days in a row last week, a close inside the bollinger bands seems more than likely today. If we then saw a lower close on Vix tomorrow we would have a Vix buy signal (for equities). One caveat to mention is that the overhead gap I've been watching has not been closed as yet:

DX reversed downwards hard on Friday from the nice looking bull setup I was talking about on Friday morning. There's a bull setup on EURUSD this morning, though it would require a conviction break up through broken rising support there:

I'm astounded to see 30yr Treasuries rising this strongly in a period where US default looks possible, and a downgrade of US debt by ratings agencies looks likely. Nonetheless the possible continuation IHS that I posted on Friday morning is now fully formed, and ZB has broken up through the neckline. This is worth watching as a big move up on ZB would normally be seen while equities fall, as was the case last week. I'm expecting a rally on equities so I'm expecting this break up to fail. Something to watch:
I'm doubtful that we'll see a moonshot on equities from here, but I think that, debt ceiling negotiations permitting, we are close to seeing a short term low that should be followed by a strong rally. It seems very likely now that there will be a debt ceiling deal, but it's worth noting that any deal will most likely not be finalised until tomorrow, and very possibly after the market closes tomorrow. We might see some uncertain chop until the deal is done. Short term I'm watching support on ES at 1300 and there is strong resistance in the 1312 area.
NQ Symmetry (by eMiniSchool)
There is something to keep in mind going into next week and that is the symmetry of the market. Symmetry is the true support and resistance of the market. We get the symmetry buy using Fibs on each leg of each pattern.
From the March 09' low the symmetry of the NQ and TF has been only .382 which is on the faster side of the equation. You can see this by looking at a weekly NQ chart and you will see the pullbacks have been shallow in price and time.
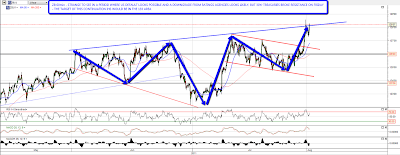
The chart in this post is the 60 minute and you can see the .382 is still in play two times within the last wave up (Still Bullish)
We know there is a lot of news flow right now but it is important to look at the charts to see if the pattern is broken and so far the pattern is not broken to the upside. Of course patterns can fail but we stay with the pattern and direction until we are proven wrong and so far we have been rewarded in buying the dips and that condition is still in play.
There are two degrees of the pattern the major and the minor. On the NQ the major .382 support is 2325.59 and the minor .382 is 2337.14. When you look at the chart now they will seem like obvious support levels the key is to know the symmetry support before the level is hit so you we can get back in the long trade.
To see the weekly and daily levels we posted a video on July 5th here:
http://wwweminischool.wordpress.com/2011/07/14/nq-symmetry-382/
In that post there is a link to a video explaining what we were looking at and that condition is still true right now.
Happy Trading,
Sean
PS. This is pattern and patterns can fail but as of right now the pattern is still true and we are looking for targets of 2476 to 2500 on this next leg.
