
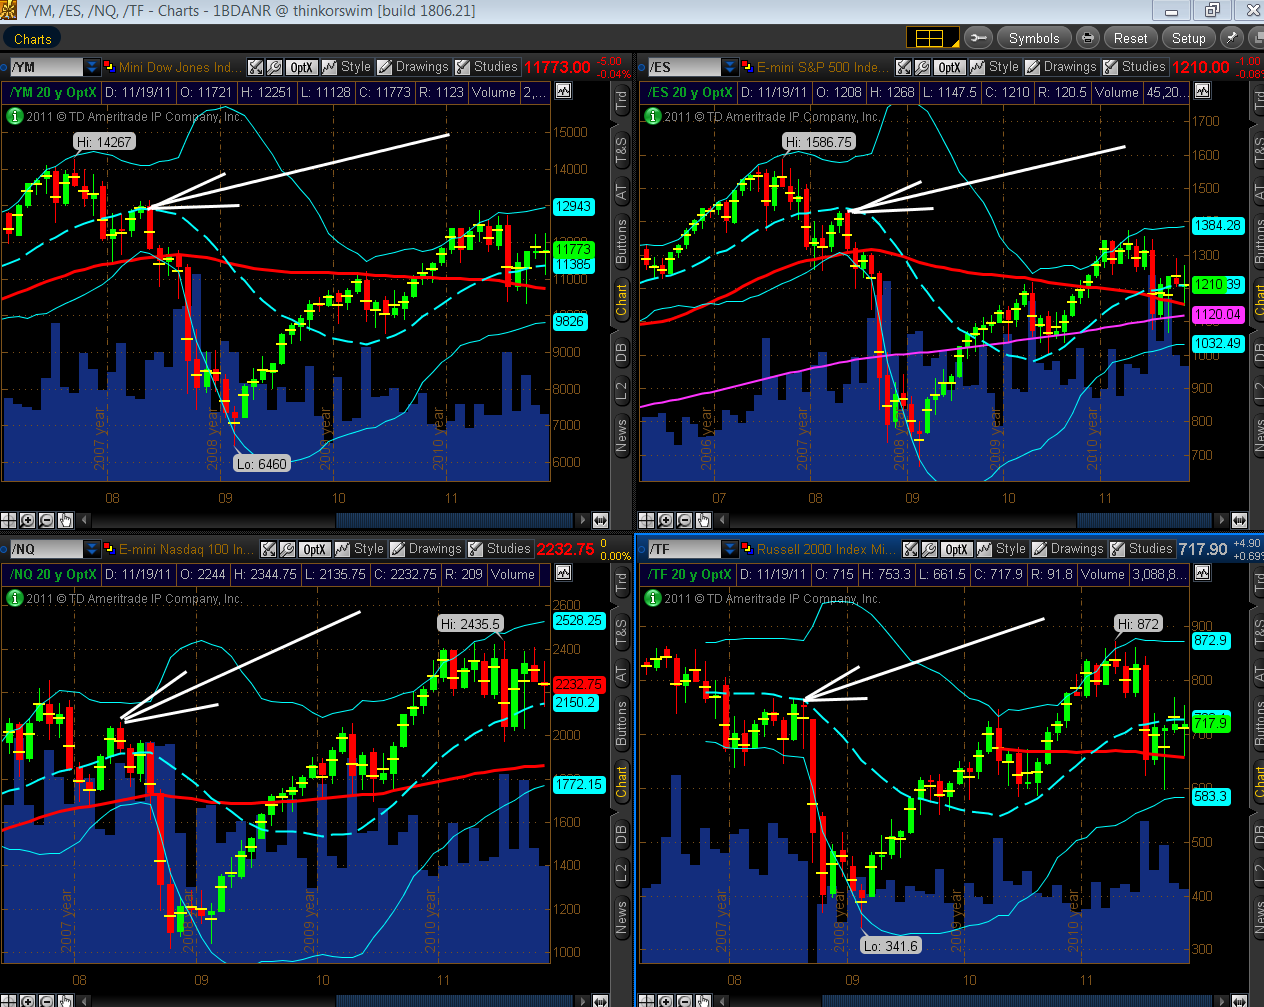
Today saw the YM, ES, NQ & TF close out their 4th quarter options contract for 2011. Each candle on the chartgrid below represents a one-Month Options Expiry period. Most of the price action after the large red July-August OPEX candle has taken place inside that candle's range. The last three candles reflect indecision in these markets on consecutively lower volumes (large upper and lower wicks).
Unless renewed optimism enters equity markets on a global level in the new year, we could see these e-mini indices mirror a drop similar to the one that occurred in 2008 after the arrows that I've added. Granted, they may not fall to the same extent, but a fall (and, potentially, a substantial one) is possible, nonetheless…at least to the bottom of their Bollinger Bands.
Below is a Daily chartgrid of the YM, ES, NQ & TF. The YM, ES & TF are hovering around their 50 sma (red), while the NQ has been weaker of late. Next week, I'd be looking to see whether they move above or below this moving average, and on what kind of volumes. No doubt, volumes will be lighter, so we could see some volatile moves intraday.

Below is a 4-Hour chartgrid of the YM, ES, NQ & TF. They were unable to hold at today's highs and are currently below their 200 sma (pink). Of note is the fact that the NQ is under the influence, once again, of a bearish Death Cross formation (50 sma below 200 sma). The moving averages on the others are merging. I've found that once these moving averages merge, we tend to get a rather large move one way or the other afterward. At the moment, the NQ is signalling a bearish move…if we get a Death Cross on the others, that will also signal a move down. While the YM led today's move down, it will be important to see whether the NQ, as well as the YM experience much weakness next week. I'll be watch these two e-minis to set the tone for the other two.

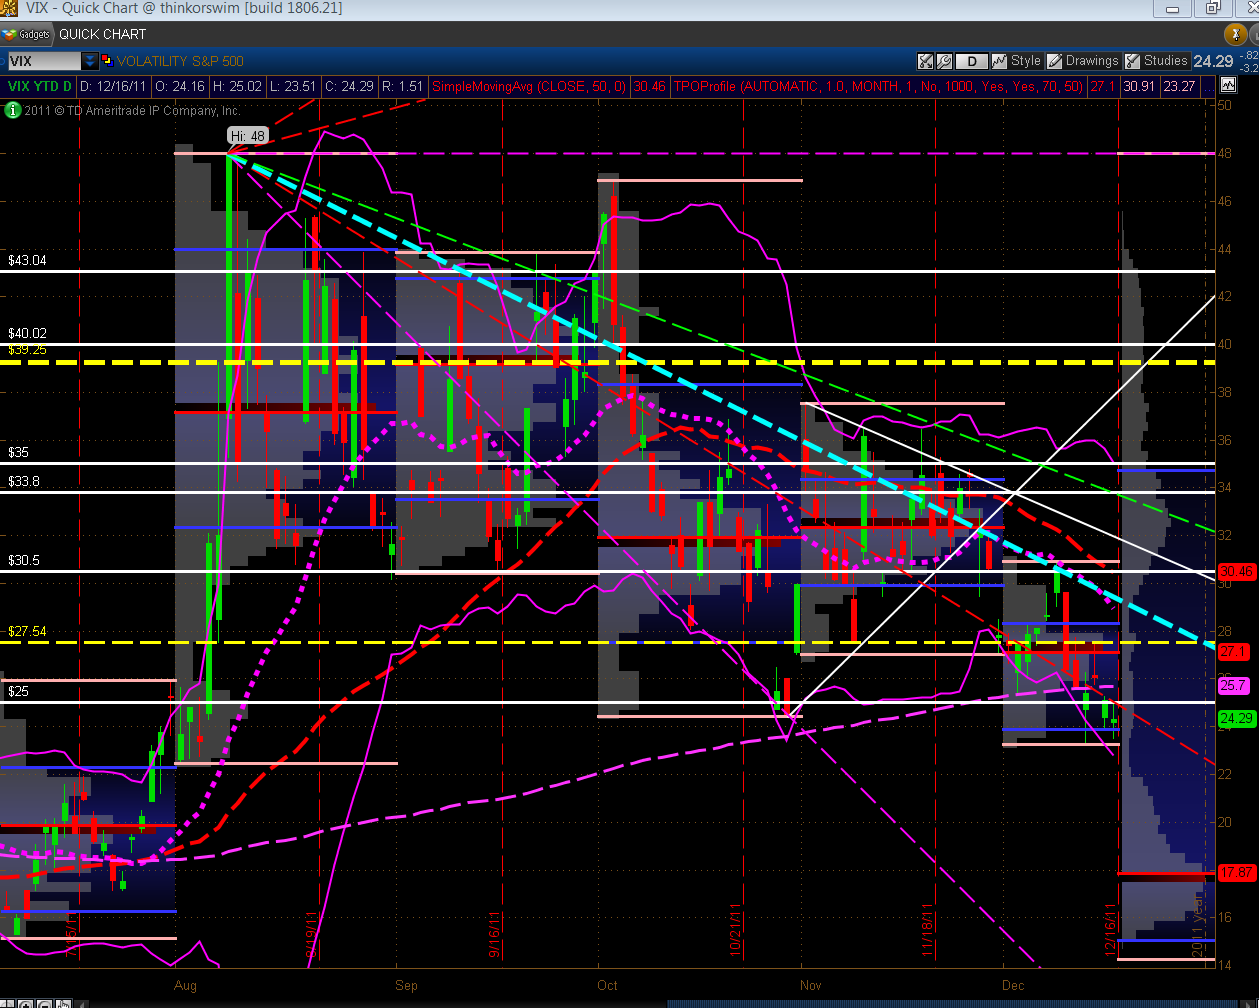
Today, the VIX closed below the 25.00 level as shown on the Daily chart below. I'd be looking for a move back (and hold) above 25.00 to confirm any bearish movement next week, as well as any sustained move down in the S&P 500 Index.
We'll see what Santa has in store for the markets next week…have a great weekend!

