
Further to my last weekly market update, this week's update will look
at:
- + 6 Major Indices
- + 9 Major Sectors
- + Trendline Breaks on 7 Major Indices
- + Percentage Comparison Chart of 4 Major Indices
- + Ratio Charts of SPX:VIX, RUT:RVX, NDX:VXN
- + Ratio Chart of AAPL:NDX
- + 30-Year Bonds
- + European Top 100 Index
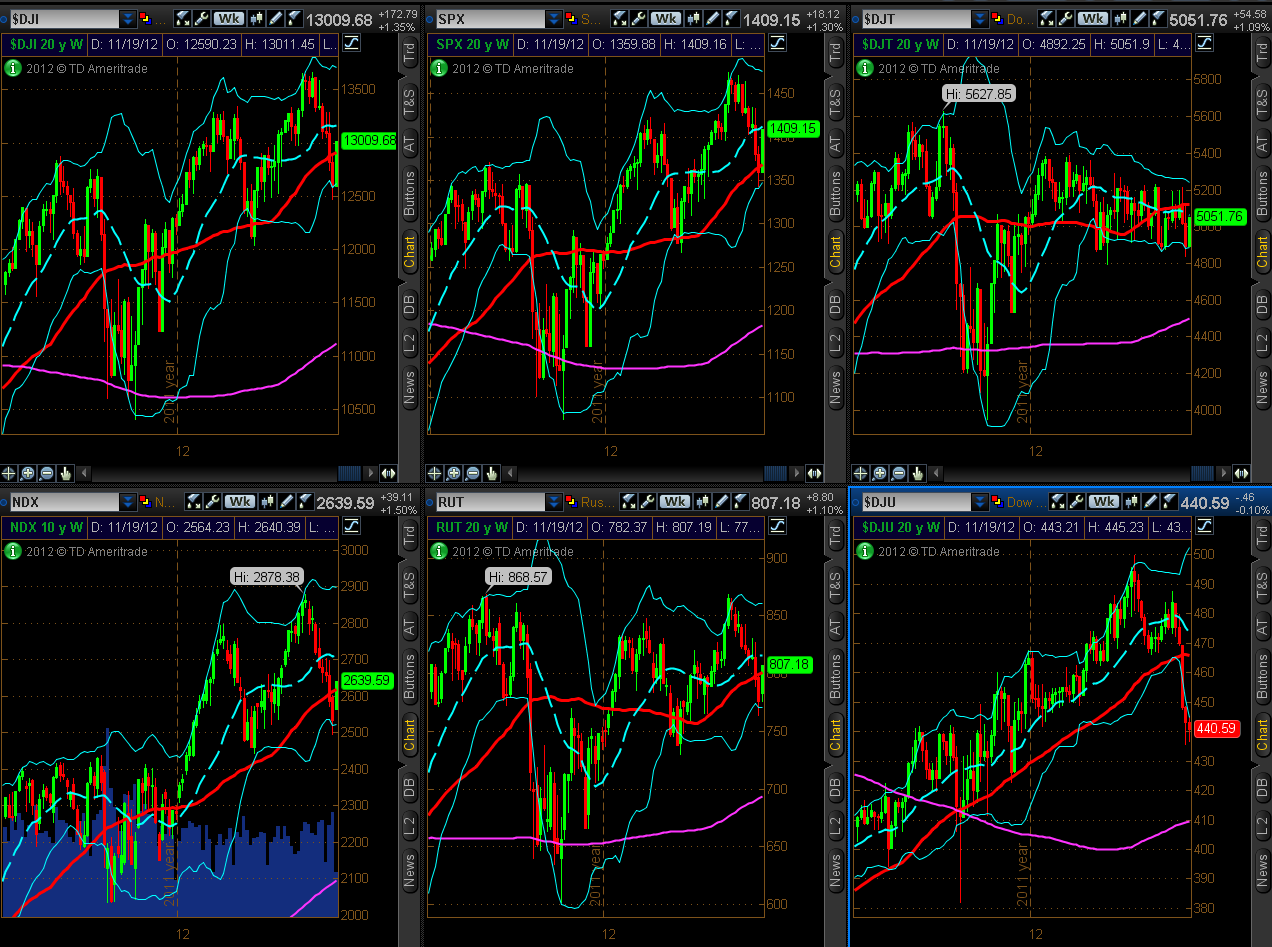
6 Major Indices
Five of the six Major Indices rallied and closed
higher this past week, as shown on the Weekly charts and the 1-Week
percentage gained/lost graph below. The Utilities Index extended its
prior weeks' losses.

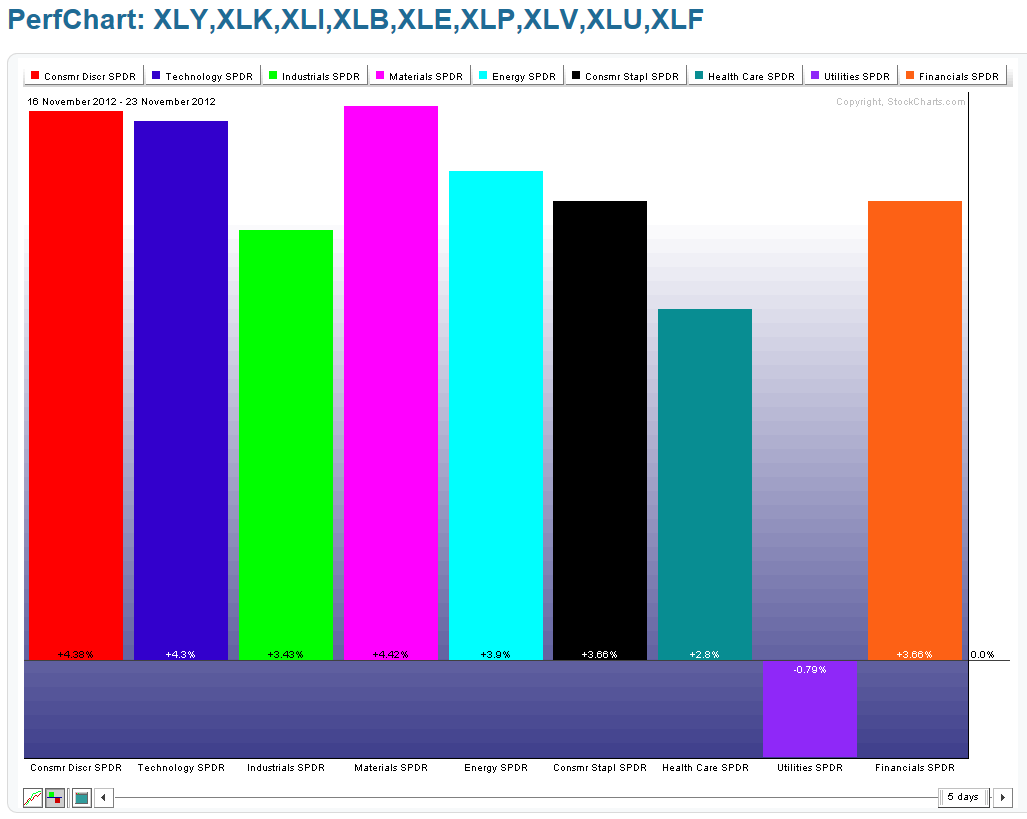
9 Major Sectors
Eight of the nine Major Sectors rallied and
closed higher this past week, as shown on the Weekly charts and the 1-Week
percentage gained/lost graph below. The Utilities Sector extended its
prior weeks' losses.

Trendline Breaks on 7 Major Indices
Each candle on the
charts below represents a period of three (3) days. The current candle
closed today (Friday). I first wrote about these seven Major Indices and their
major trendline breaks here and here. Since then, price did continue downward, but has since
rallied during the past six days.
Those indices now testing the
underside of their major uptrends from the October lows are the OEX and SPX. In
fact, the SPX has now closed just above this trendline. A hold above 1400 and
this trendline should produce a continued rally in the SPX. Similar backtests,
breaks and a hold above trendlines on the others should bolster such a rally in
the SPX. Alternatively, a failure of the SPX to hold above 1400 could send it,
along with the other indices, down to new lows.


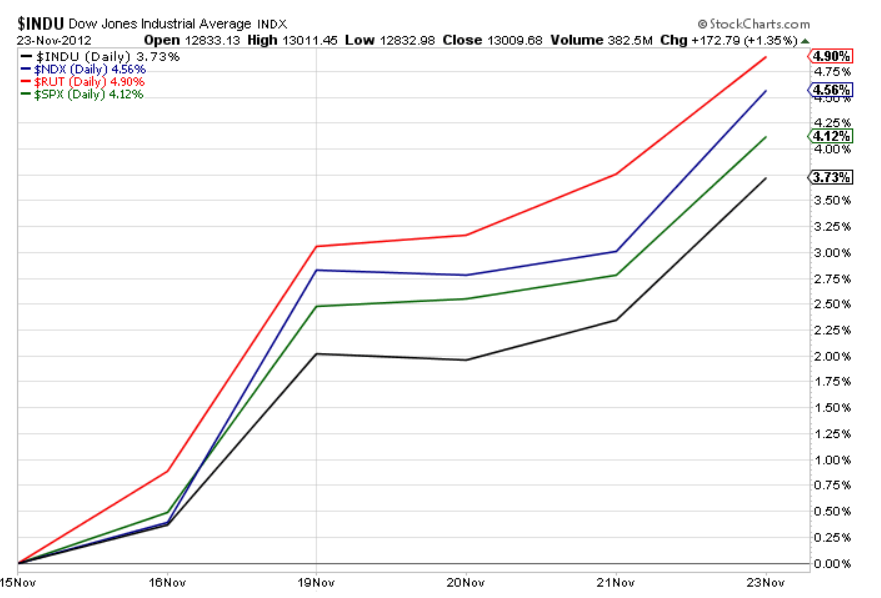
Percentage Comparison Chart of 4 Major Indices
I mentioned here that the Russell 2000 Index was the leader ahead of the
Nasdaq 100, S&P 500, and Dow 30 Indices in terms of percentage gained from
the lows of last Friday (November 16). As shown on the updated
percentage comparison chart below, that's still the case, and
it's still the one to watch to see if buying favours the riskier Small-Cap
sector over Technology and Large-Cap/Blue-Chip stocks. Alternatively, I'd watch
to see if this index begins to weaken, particularly below the 800.00 level and
on rising volatility, which could send the other indices down to fill their
respective gaps from this past Money, and lower.
I've also included the
updated 60 min (market hours only) chart of the TF (E-mini Russell 2000 Futures
Index) (counterpart of the RUT), which shows the corresponding 800.00 level,
which is around the 40% Fibonacci retracement level from the September high to
the recent low. Monday's gap remains unfilled, and, whether this is a breakaway
gap and the beginning of a trend reversal remains to be seen. I'd like to see
price hold above the 800.00 level and begin to make higher highs and higher lows
on this timeframe before I'd make such a call. Otherwise, a failure around this
level would likely send price down to, potentially, fill the gap and on to a
lower low.

Ratio Charts of SPX:VIX, RUT:RVX, NDX:VXN
I'm still monitoring
market volatility to try and gauge market strength versus weakness going
forward. I prefer to measure the strength of several of the Major Indices
against their respective Volatility Indices by looking at the following
Daily ratio charts. As you can see on SPX:VIX, RUT:RVX, and
NDX:VXN, they broke above major resistance (broken horizontal blue line),
continued to rally, and stopped just below the next resistance level. The
Momentum indicator has continued its ascent above the zero level and may be
signalling that more strength is in store for the SPX, RUT, and NDX. A break and
hold above these next resistance levels will likely produce a continued rally in
these indices…particularly if the SPX holds above its 1400 level, as mentioned
above, and if the other Major Indices break back and hold above their respective
major trendlines.


Ratio Chart of AAPL:NDX
I've also added a Daily ratio
chart of AAPL:NDX. You can see that AAPL has declined at a greater rate
than the NDX, has been comparatively much weaker, and price on this has also
closed above major resistance (broken horizontal blue line) to rest in between
the bottom of the rising channel and horizontal price resistance. The Momentum
indicator, while still in a downtrend, may be signalling a positive divergence
with last Friday's bounce into the close…one to watch going forward into next
week(s), as any gathering strength (and break and hold above resistance) would
likely positively influence the SPX and NDX. Alternatively, a resumption of
accelerating weakness, which sends AAPL below its equity price of 500.00 (and
lower), would likely negatively impact these Indices (last Friday's low on AAPL
was 505.75, so this is still a possibility, as noted here).

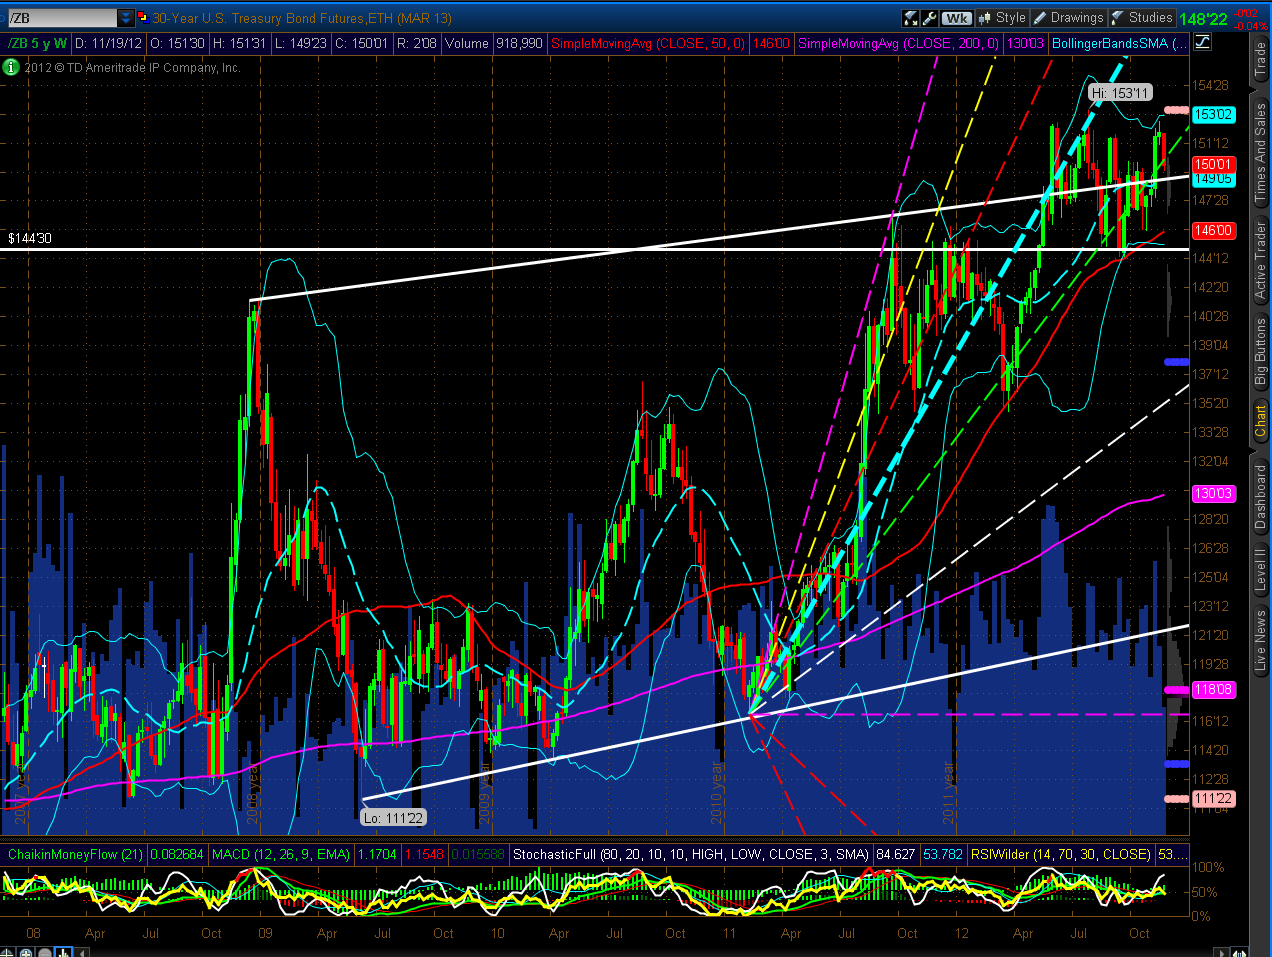
30-Year Bonds
Price on the Weekly chart below of
30-Year Bonds closed on Friday just above near-term support. Failure to hold
this support level may induce serious bond-selling, which could begin on a
larger scale if price then failed to hold at the next support level (around the
lower Bollinger Band/50 sma). Any substantial weakening of Bonds may produce a
large-scale rally in equities…one to watch over the next days/weeks.
European Top 100 Index
I last mentioned the European Top 100 Index
here. Price had broken and closed below horizontal support. It
then proceeded down to the 200 sma and bounced to close back above the 50 sma
and in between support and resistance, as shown on the Daily
chart below. As you can see, price has been wandering sideways in a
range since the beginning of August and has been reactionary to news events from
Europe. As I recently mentioned here, it would appear that delays are to be expected
indefinitely while Europe grapples with its many issues related to their
unravelling European Union and recession. As long as major decisions keep on
being delayed, no doubt we'll continue to see this kind of uncommitted price
action in Europe, which, would, likely have a negative affect on those U.S. (and
foreign) business/financial institutions involved with Europe.

In
summary, I'll be monitoring market reaction to Beige
Book data once its released this Wednesday at 2:00 pm EST. Any
surprises may send equity markets down…otherwise, I'll be looking for a
strengthening rally on declining volatility, if the Major Indices can continue
to advance and break (and hold) above major trendline resistance. Along with
that, I'll be watching the 30-Year Bonds and the European Top 100 Index for
strength/weakness signals.
Enjoy your weekend and good luck next
week!
