
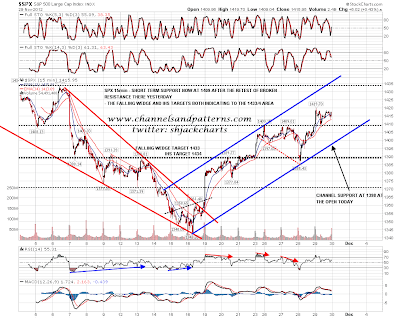
One thing I don't like to see when I'm long is marginal new highs and significantly negative RSI divergence under strong resistance areas, and that's exactly what I'm seeing this morning. I have clear targets at 1433/4 on SPX from the falling wedge and IHS targets on the SPX 60min chart, but there is a real possibility of reversal and retracement right here.
On the SPX daily chart the primary target is the upper bollinger band in the 1437 area, but there is often failure or short term reversal at an intermediate major moving average, which in this case would be the 50 DMA at 1422. The high yesterday was at 1419.70 which was close enough to qualify as a test of that:

On the SPX 60min chart you can see the strong resistance zone 1420-30, and SPX tested that at the high yesterday:

On the SPX 15min chart the low yesterday was at 1409 at the retest of broken resistance there. That is short term support but but a break below it would trigger a double-top target at 1399. I have rising channel support at 1398 at the open so there should be decent support there:
Looking at ES the same bearish setup would trigger an M top target at 1394.5 on a break below 1407. Rising support from the low on ES is also at 1394.5 at the moment, intersecting with broken declining resistance from the high:

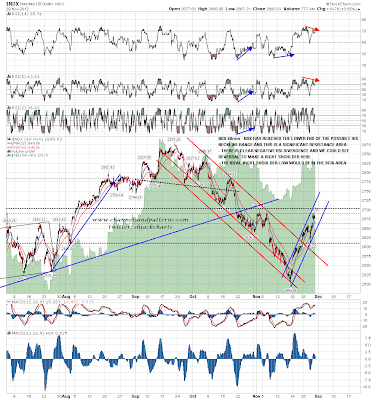
I was looking yesterday morning at a possible IHS forming on NDX. NDX touched the lower end of the ideal neckline range yesterday, again on strongly negative 60min RSI divergence. The ideal right shoulder low would be close to 2637:
Nothing of much interest on bonds, gold or oil this morning but EURUSD is showing the same reversal signals at strong 1.30 area resistance. The M top target there would be in the 1.2865 area with strong support in the 1.2875 area just above:

I'm still leaning bullish overall but we may well see some retracement today and that retracement could obviously test the support trendlines from the low on SPX and ES. First support on SPX is at 1409 and on a break below that the double-top target is at 1399. This bearish setup could be negated with a strong move up today but until we see that this setup looks short term bearish, supported by a similar setup on EURUSD. The longer term bull scenario should be unaffected as long as rising support on SPX and ES holds, so any reversal into that would look like a decent long entry.
