
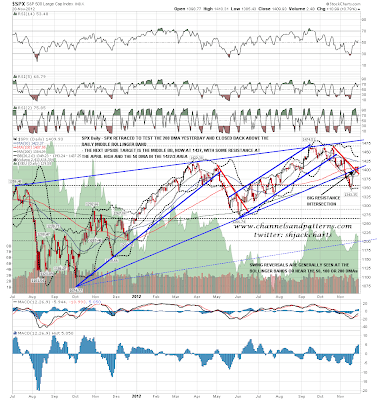
The retracement low yesterday ticked most of my boxes. On the ES 60min the M top target at 1383 was tested, but 1388 support held on an hourly close basis. On the SPX daily chart we then saw the close above the middle bollinger band at 1394 that I was looking for. The upside target on the SPX daily chart is the upper bollinger band at 1437 (still declining slightly), with some potential resistance on the way in the 1422/3 area at the March/April highs and the 50 DMA:
On the 60min chart SPX pinocchioed the IHS neckline but held it on an hourly basis before making a marginal new high. I'm definitely leaning bullish here but it's worth noting that there is a marginal new high here on arguably negative RSI divergence. I say arguably as I normally disregard these divergences once RSI has moved much below 50 and we saw that yesterday. Nonetheless some follow-through to the upside is needed soon to confirm the move towards the falling wedge and IHS targets in the 1433/4 area.

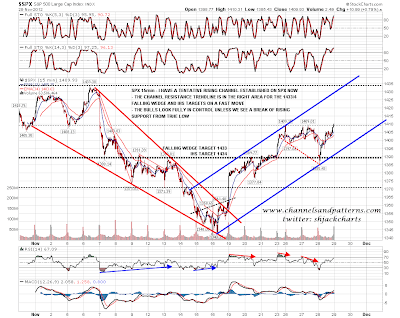
On the SPX 15min chart we now have a tentative rising channel established at the low yesterday. The upper trendline needs another touch and reversal to establish this channel firmly, but the upper trendline is in the right area for a target of 1433/4 if hit tomorrow. There is some resistance at 1433.38 at the early November high:
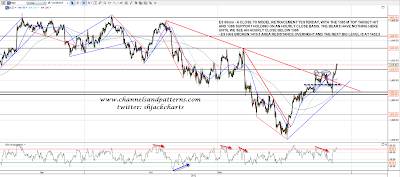
On ES, as I mentioned, the M top target was hit yesterday at 1383 and 1388 held on an hourly close basis. Overnight ES has broken above my resistance level at 1410.5 and I have the next decent resistance level at 1432.5. If we see a dip today I have support at 1410.5 and just above 1400 at the hourly 50 and 100 MAs:
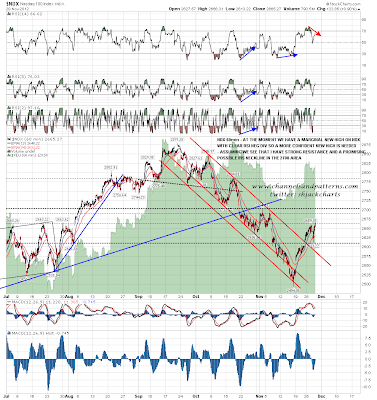
I have a nice looking target on NDX in the 2700 area where I have a possible IHS neckline. If we see a reversal around there it might therefore be to form the right shoulder on an IHS indicating to new highs in 2012 or early 2013. That fits fairly well with the 1433/4 target on SPX and is worth watching here. Short term, and more so than on the SPX 60min chart, we have a marginal new high on negative RSI divergence and a more confident new high is needed shortly:
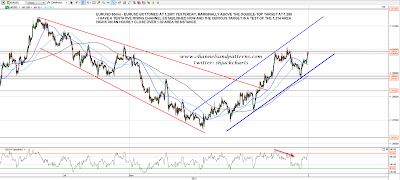
On other markets EURUSD bottomed yesterday at 1.2881, a whisker above the double-top target at 1.288, and has rebounded strongly. I have another tentative rising channel established there and on an hourly close above 1.30 area resistance I'll be looking for a test of the October high in the 1.314 area:
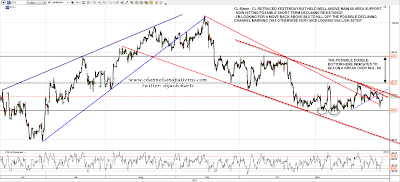
CL bottomed above 85 area support yesterday and is testing short term declining resistance. Overall this is still a nice looking bull setup and I'm looking for a move above 88.2 to kill off the possible declining channel that I've marked on the chart:
I mentioned yesterday that there was a rising wedge on the gold chart but GC broke down in the minutes before I posted that chart on twitter, which was irritating. GC made a low yesterday just above the previous low and a strong support level has been established in the 1703-5 area. It looks as though a broadening formation, right angled and ascending, may be forming on GC with the next upside target in the 1760-70 area. These patterns are 66% bearish but tend to be poor performers after breakout:

I've been leaning bullish on the bigger picture scenario all week, and I didn't see anything yesterday to change that view. There is a potential game-changer today though with the GDP number being announced an hour before the open. The consensus number is an ambitious looking 2.8% growth which doesn't leave a lot of room for a beat and leaves considerable room for disappointment. A bad number could obviously move the market considerably.
If we see a dip on ES today key support is in the 1386-8 area which needs to hold (for the bulls) on an hourly close basis. I have intermediate support at 1410.5 and just above 1400. If we are back on normal bull programming I'd be looking for an early dip followed by strength for the rest of the day.
