
Beef may be back on the menu within the 1st quarter.
After looking around at a few risk ratios I haven’t looked at in a while and given recent developments in price action, I think there is more cause for concern here than many think.
I have reason to believe that Mr. Market is lying to us.
Now he doesn’t know it, but I have him in my crosshairs. One wrong move and he’s going to drop faster than smiles at an oil convention.
I know, I know. This is also my typical tendency after a move gets going, but check out the charts and see if I’m off base. My current mindset is that I am long with the belief that price could most certainly make it back to the highs, but the VIX, TICKs, and price structure of highs and lows must continue to support that view. So far they do and I will remain long until they do so. Let me show you what has me concerned though.
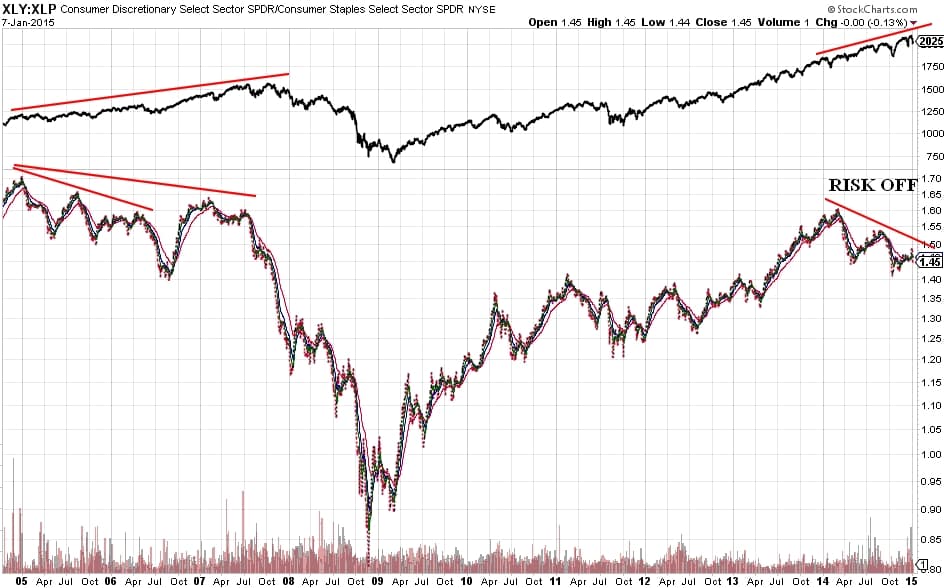
First off is the XLY:XLP risk ratio. It is a relative strength chart of XLY vs XLP which generally is supposed to reflect attitudes towards risk. XLY is the Discretionary SPDR ETF which generally advances when risk is being sought and performs poorly when risk is being avoided. Oppositely, the XLP is the Staples SPDR ETF which generally performs better when risk is off and poorly when risk is on. At the moment, the XLY:XLP ratio is reflecting a condition of lower highs and lower lows despite higher highs and higher lows in the S&P500. This does not mean we are going to sell off this quarter or next though (note that the prelude divergence into the 2007 top took years while the S&P marched ever upward and sharply, too). All I am saying is that it is simply a reflection of attitudes toward risk and that this may be an indication that the bull market is in its final stages. There are plenty of other months apart divergences that turned into nothing at all (and some that did, including mid-2011’s 20% drop) so it’s not perfect and should only be one of many tools.
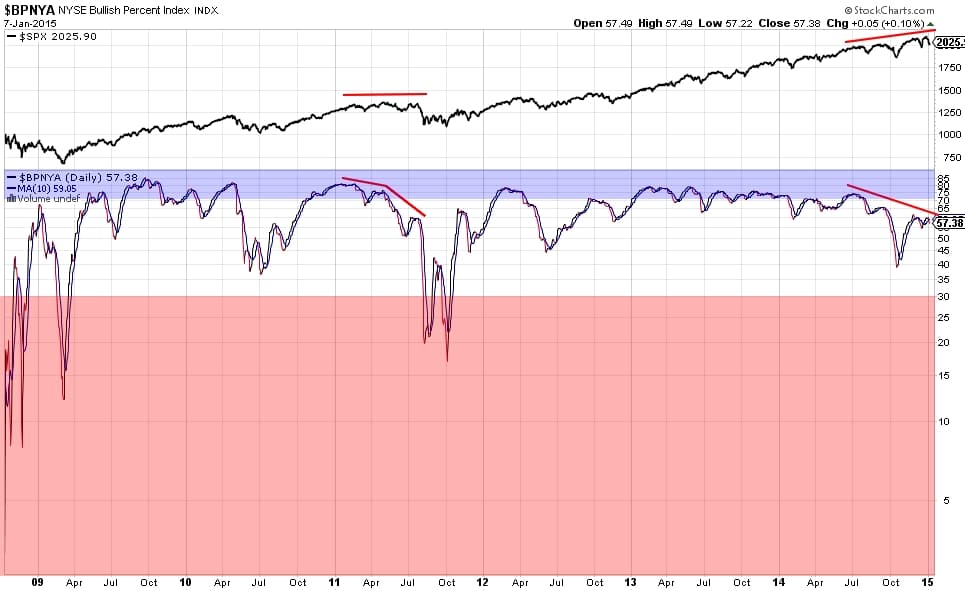
Secondly, I have the NYSE Bullish Percent Index which is also showing a negative divergence. This is more concerning for the coming weeks. For those who don’t know what the BPI is, it is a breadth indicator which represents the percentage of stocks that are on Point & Figure buy signals. A simpler way to say it, is that it represents the percentage of stocks that are in uptrends (though that’s not exactly accurate, but close enough). I’ve found that divergences above the 65-70% area are really not a big deal and can happen with sector rotation and congestion/resting periods. However, when the divergence extends below the 65-70 area, then that is cause for concern. The last time this happened was (AGAIN) mid-2011 when we got that 20% base jump from the large H&S pattern. If the S&P can make a lower weekly low below 1970, it will reverse the weekly uptrend to a downtrend and it will be time for dip buyers to take a vacation or get slaughtered. Price could easily hit the October lows again.
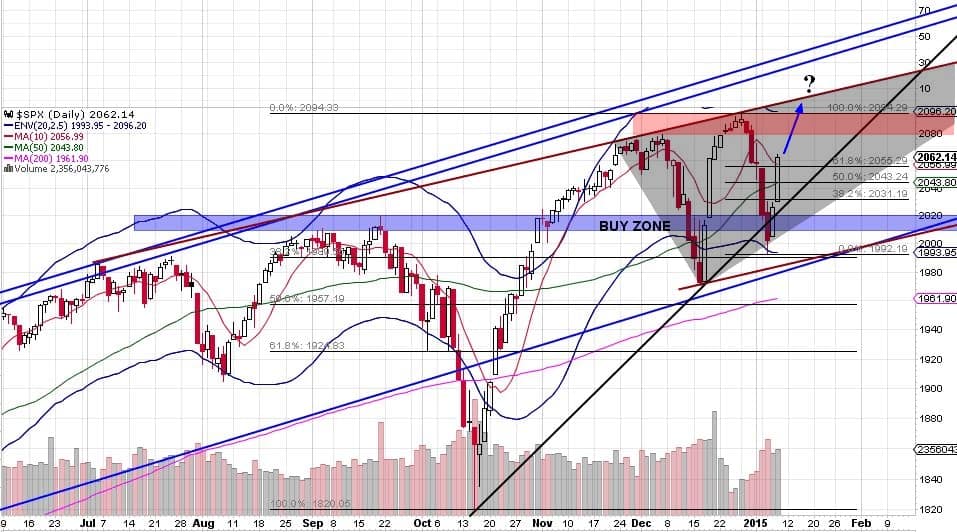
This is a chart of the S&P 500. Just ignore the black uptrend line from the October low. I find when trend lines are abused like that one so quickly, it is most likely meaningless and price is probably going to be trading in a congestion zone rather than trending. Despite the negative breadth backdrop, price structure still looks fine, but the price is where the games take place. The condition tells you what’s really going on. Nevertheless, price gives us levels to gauge trend and price is ultimately what any trading position is going to be based on so it does us no good to argue with it. Truthfully, the S&P 500 is still making higher highs and higher lows. This last low, however, was pretty weak in my opinion and does not reflect aggressive demand because it pulled back so far when we had a pullback just last month. I am giving price the benefit of the doubt that it can make new highs given its current structure, but I will be watching closely around the red zone for reversal signs. An equal or lower high would begin to confirm that the market environment is changing and that sellers may have gained the upper hand in a larger way.
Buyer Beware.
