
My apologies for the late post, I had a busy morning and I’m not really in the mood today. So far it seems that SPX is feeling the same way, though it is likely compressing for a move to break up or down either today or overnight.
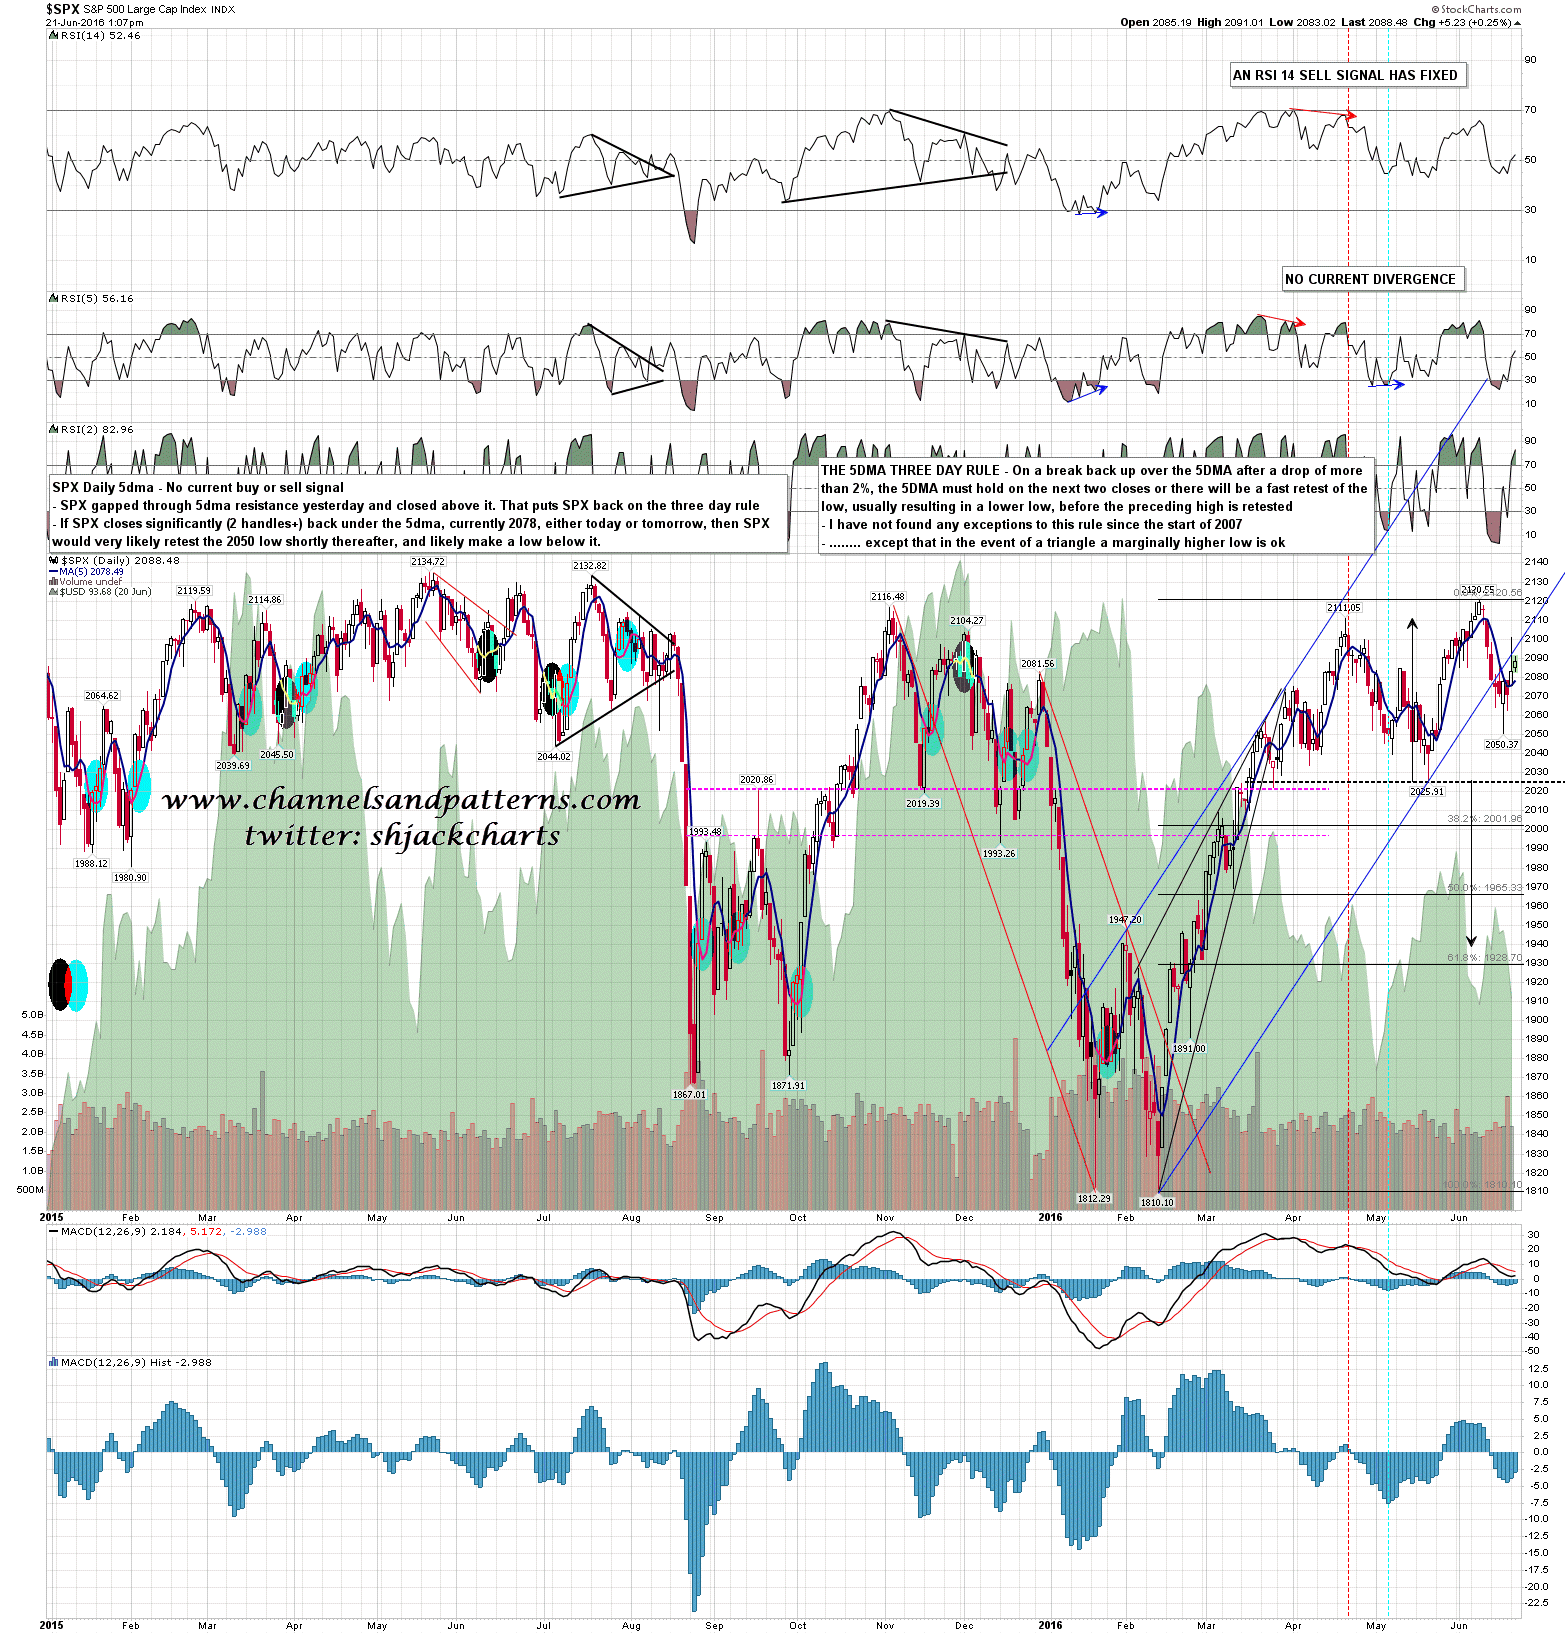
Bulls didn’t follow through on the very impressive opening gap up yesterday morning and lost potential support at the daily middle band, now at 2092, before the close, so there has been no daily closing break back above very important resistance at the daily middle band. With the current HOD at 2091, that resistance hasn’t even been significantly threatened so far today.
What was definitively broken at the close yesterday was resistance at the 5dma, and that puts SPX back onto the Three Day Rule, so if SPX closes significantly (2+ handles), back under the 5dma, currently at 2078.5, either today or tomorrow, then the statistics would very strongly favor a retest of the last low at 2050, and highly probable lower low, before any significant subsequent move up would begin. On a closing basis the daily middle band is key resistance today, and the 5dma is key support, and they aren’t separated by much, though at the pace the tape has been moving since yesterday morning, fourteen handles still seems like a long way 🙂 SPX daily 5dma chart:
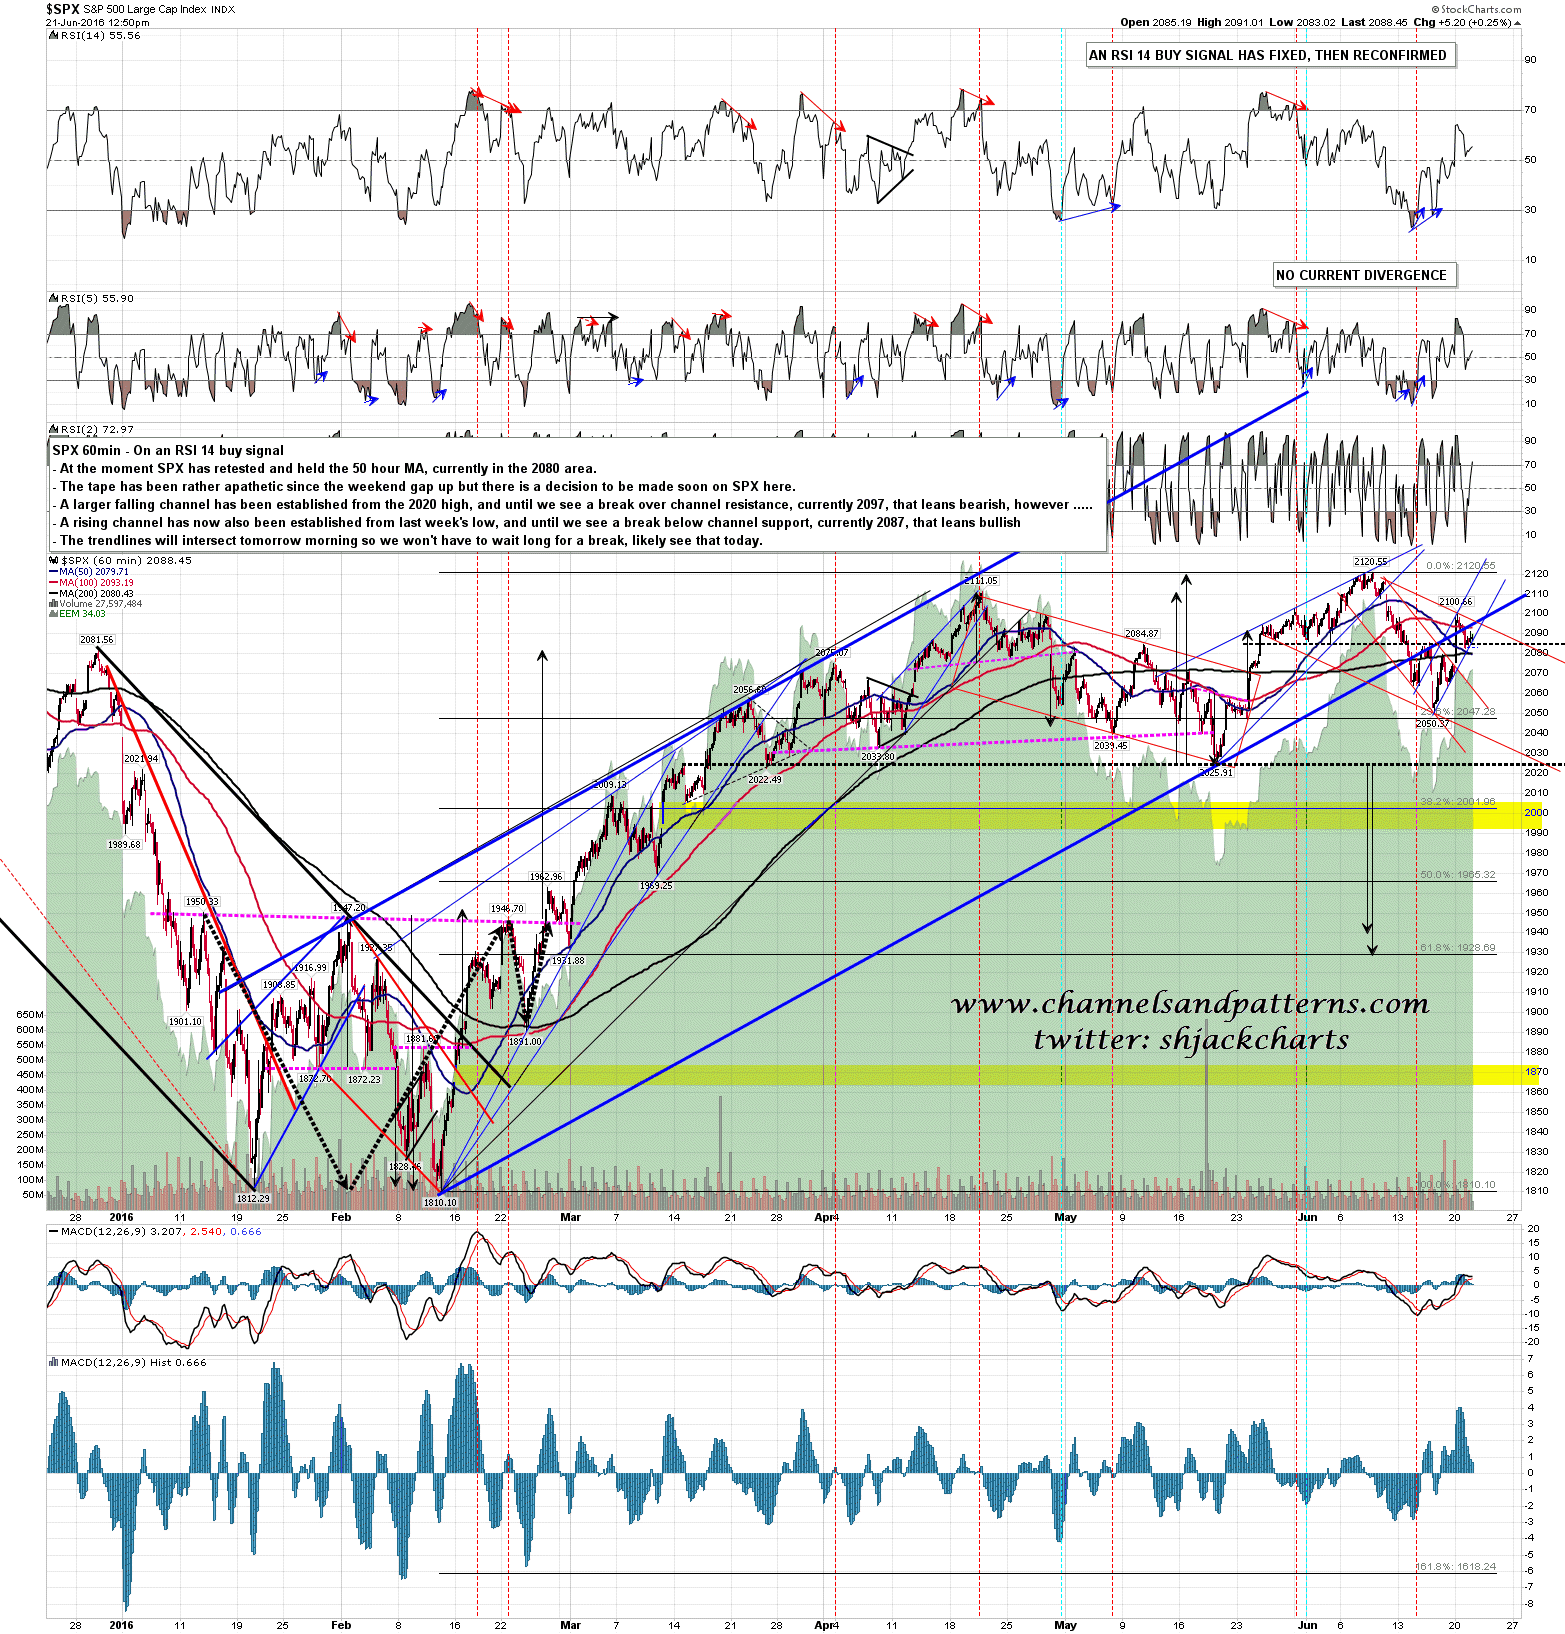
From a trendline perspective the distance between support and resistance is a bit smaller, with resistance on the falling channel from the 2120 high currently in the 2097 area, and support from the rising channel established from last week’s low at 2087 (broken as I’ve been writing). A break of either would be a provisional directional call that would require confirmation with a daily closing break of the key daily closing support or resistance level at the 5dma or daily middle band. SPX 60min chart:
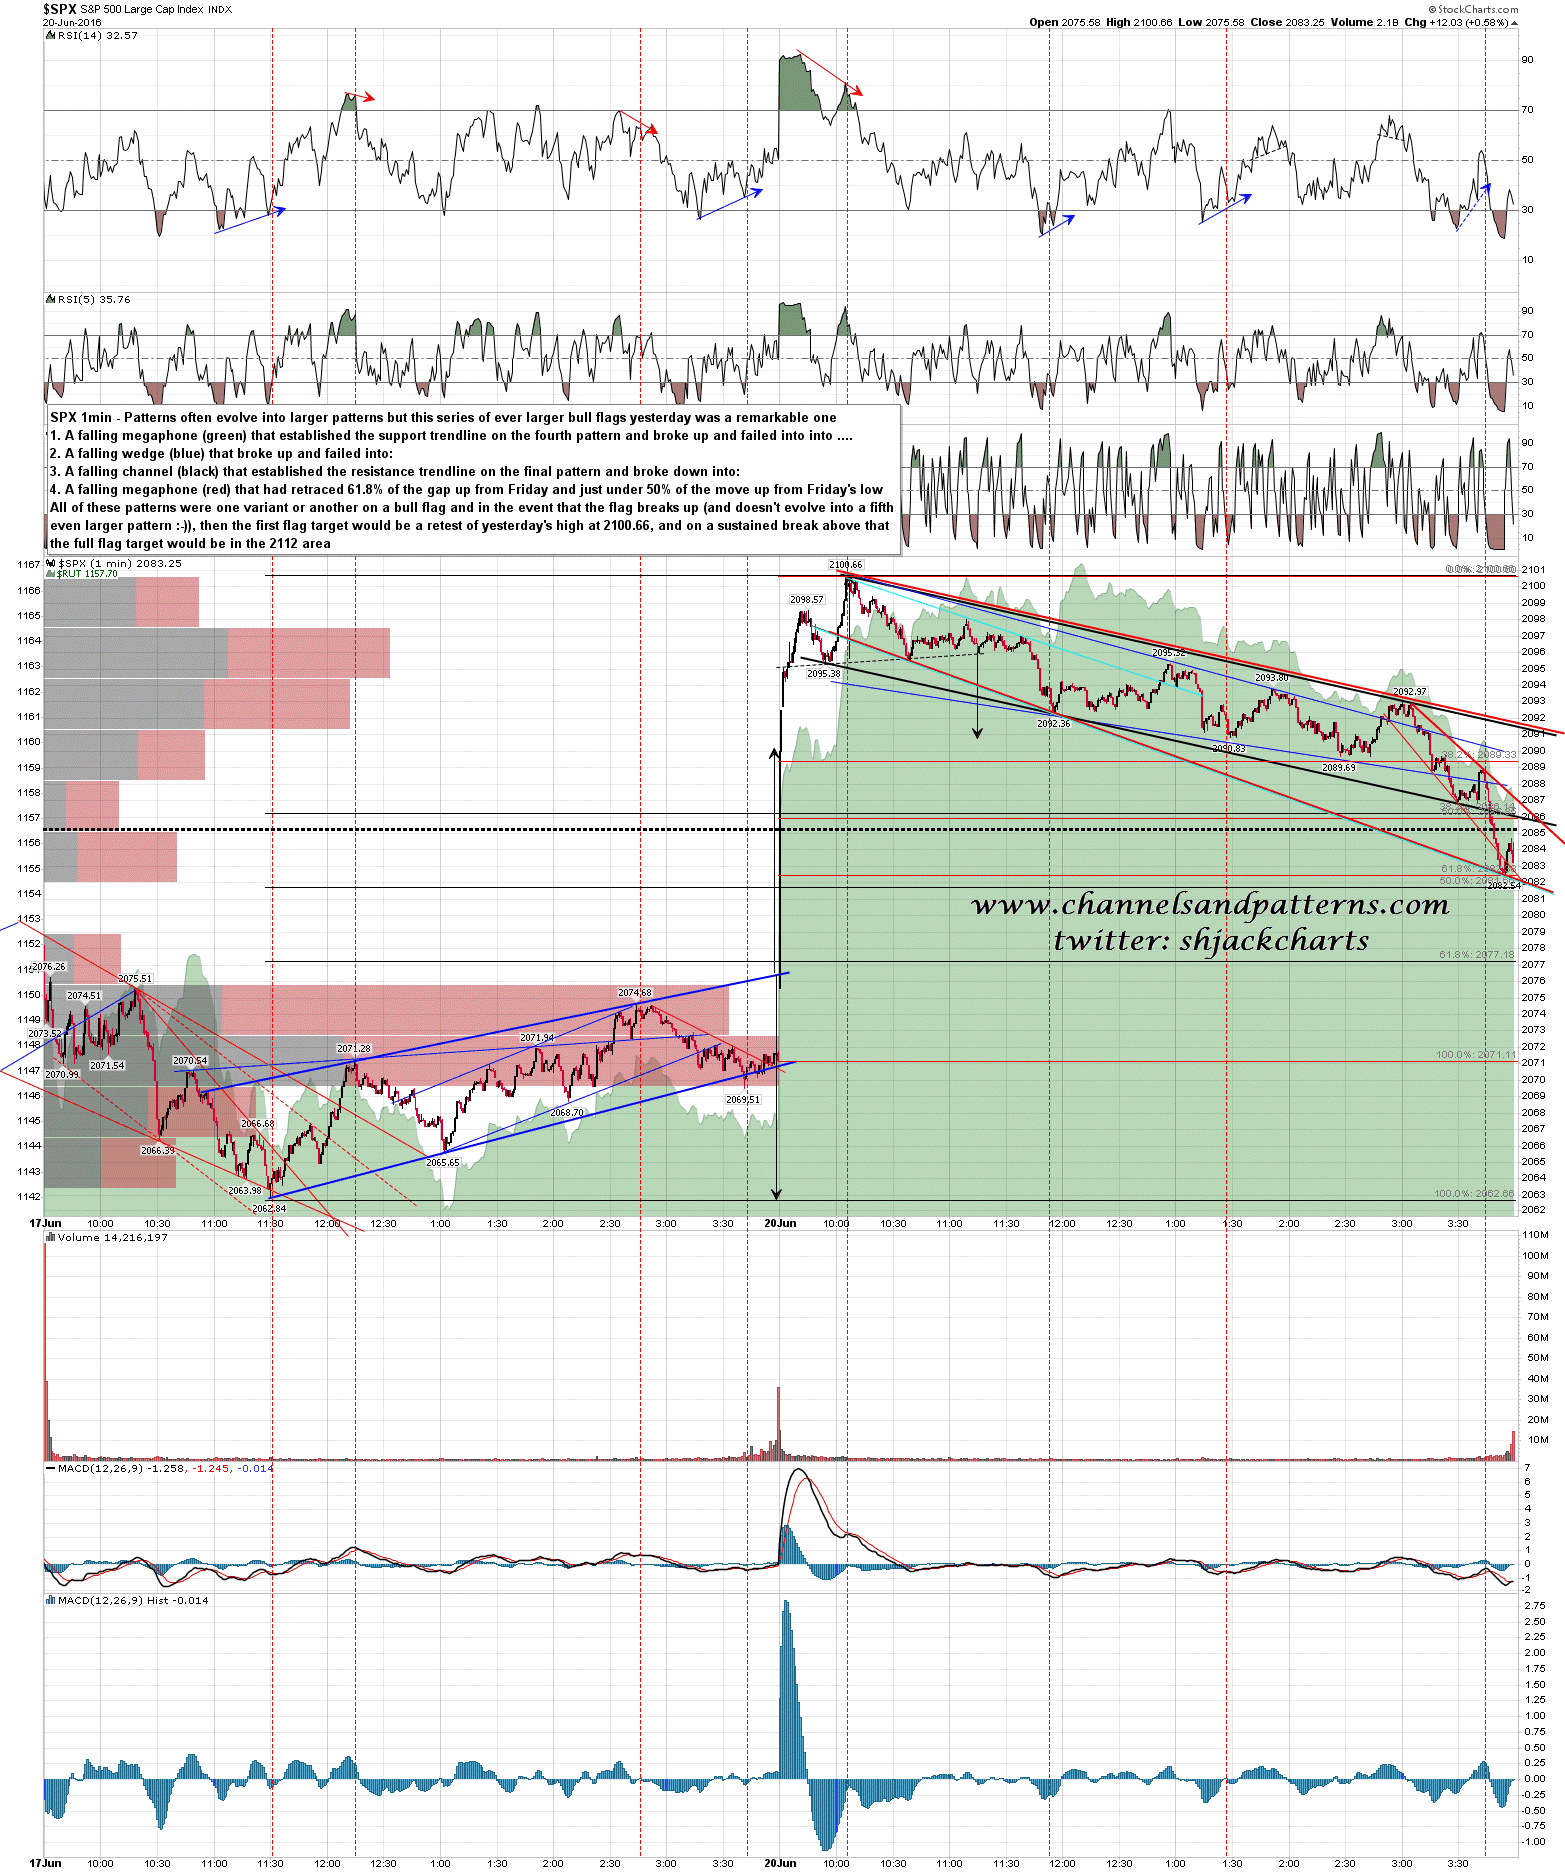
This last chart is just for academic interest really. I mention regularly that patterns often evolve into larger patterns, with the most frequent examples being rising or falling wedges evolving into channels. There was a remarkable example of this happening intraday on the 1min chart yesterday, with a succession of four decent bull flag patterns growing into each other over the course of the day from the AM high. These were all decent quality patterns and the final one has broken up today with a minimum target at a retest of yesterday morning’s high at 2100.66.
How seriously am I taking this bull flag? Not particularly as I’ve never seen this flag setup happen before, so I can’t remember what happened on any previous examples, and to evolve through so many flags conveys a certain lack of conviction. A good example of what I mean is when the support trendline on the CL rising wedge was retested a couple of weeks ago. In that instance the second test as support without first returning to wedge resistance added conviction to a strong bounce, a third test (which was seen) was starting to look worryingly overenthusiastic, and a fourth test would likely have broken the support trendline. SPX 1min chart:
The rising channel from last week’s low has broken down while I’ve been writing, and that favors the bear side somewhat. What the bears need here is a break back under the 5dma at the close, ideally today, but otherwise tomorrow, and what the bulls need is a clear break back over the daily middle band that is not rejected with a reversal candle the following day. With the action so far this week it’s getting a little hard to see either side doing much exciting, and with July 4th coming up this is low volume tape, but this should be heading into some expansion of the range soon, as listless as this tape seems at the moment.
Until the falling channel from 2120 and the daily middle band break up SPX is trading just under serious resistance, so while this could break either way, the risk/reward on short trades here is obviously better.
