Here’s your swing-trading watch-list:
Long Shake Shack (SHAK)

Slope initially began as a blog, so this is where most of the website’s content resides. Here we have tens of thousands of posts dating back over a decade. These are listed in reverse chronological order. Click on any category icon below to see posts tagged with that particular subject, or click on a word in the category cloud on the right side of the screen for more specific choices.
It wasn’t that long ago that the USD/JPY (that is, the US dollar and Japanese Yen exchange rate) had pretty much a 1.0 correlation with our own equity markets. If it was up half a percent, the S&P would be up half a percent. If it was unchanged, we were unchanged. You get the idea.
Lately, though, our own equities continue to defy every logical reason to go lower. Below is a graph of the USD/JPY. If I had shown you this chart a year ago and asked you to guess what equities had been doing, you’d probably correctly assume the Dow was down about 1500 points over the past month.
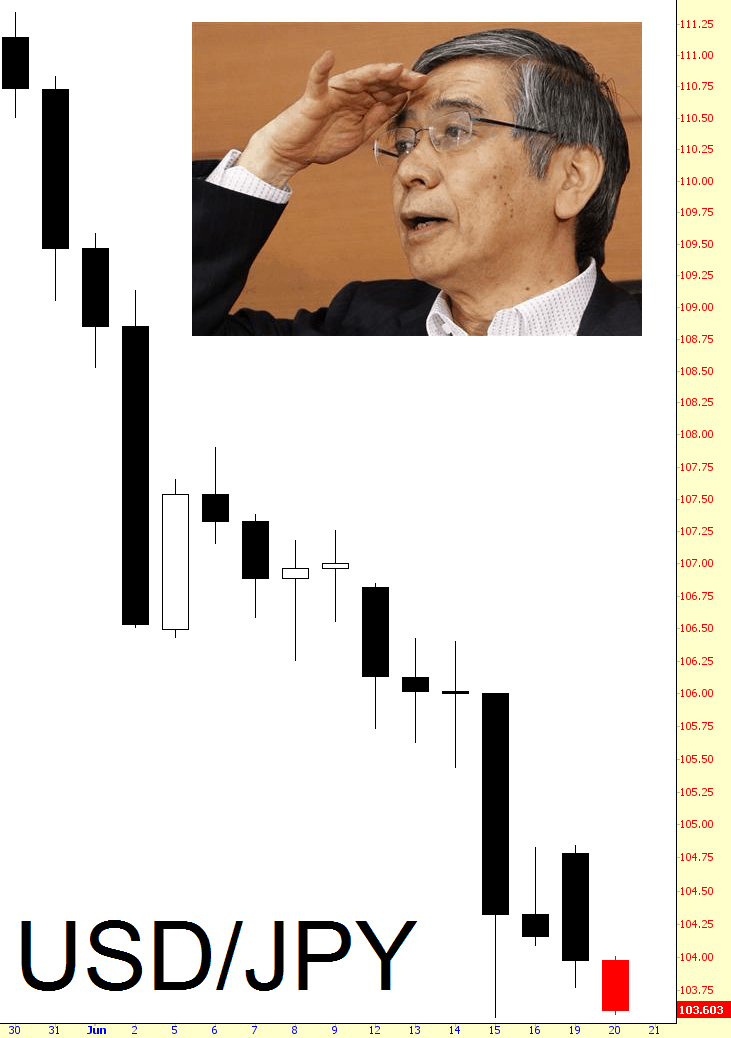
If nothing else, it’s heartening to see what happens with a central banker loses absolutely all credibility, because, I assure you, the chap in the picture above wanted exactly the opposite to happen with this chart, and he can’t seem to reverse its course.
In advance of Britain’s “Brexit” or “Bremain” vote on Thursday, June 23, the British Pound has gained momentum as of last week, and Sunday evening as I write this post.
The current price of the GBP/USD Forex pair is 1.4581, as shown on the Monthly chart below. It will need to break and stay above that level and, potentially retest 1.50, which represents the next long-term resistance level.
A break and hold below the 30-year major support level of 1.40 could have catastrophic repercussions, not only for Britain’s FTSE 100 Index, but also other major world indices. Price retested this long-term critical support level last week and is rallying.
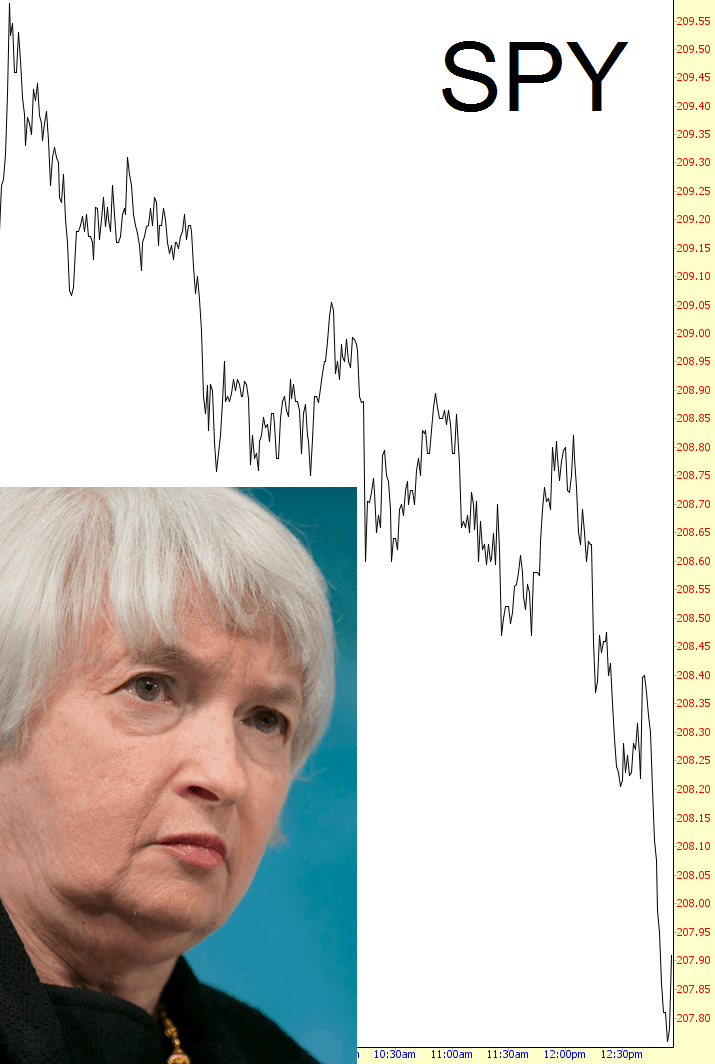
As I mentioned this morning, “All the same, these rallies based on things that DIDN’T happen have been, in my experience, not big trend-changers”. Suffice it to say, I’m glad I didn’t panic, cover everything in sight, and buy a damned thing. This was a complete wimp-out on the part of our bullish friends.