
The final quarter of 2018 spoiled me. It was fantastic. The last three weeks have reminded me what a vicious market feels like. Yuck.
I’m not alone in this, however. I just peeked at my Twitter feed (as I approach 20,000 followers – hurray!) and there were plenty of pleas for some encouragement. Well, I don’t want to “spin” things just for the sake of encouragement, but let’s look at a few principal charts together.
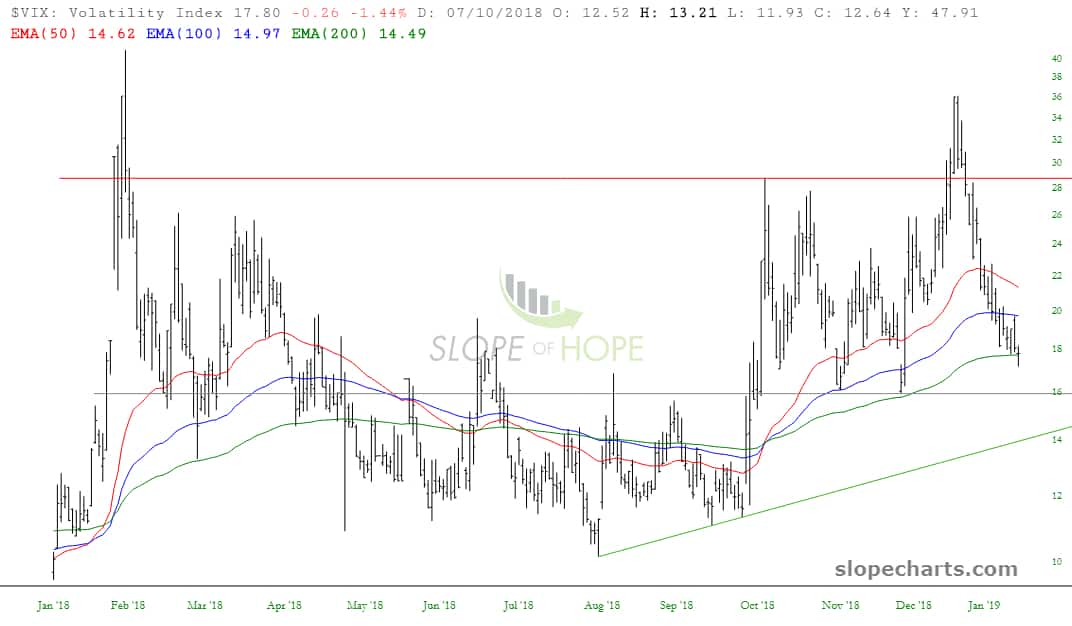
First and foremost, let’s observe the fact that over 50% of the $VIX has been blown to smithereens. Looking at the moving averages, it seems to me we have once against returned to the level of volatility where we could spring higher, rubber-band style. Even if we weaken further, I consider a level of about 16 a fairly reliable base.
The Dow Jones Composite has ripped higher, added in part by over 3,000 fresh Dow Industrial points. Take note of where the price pushed on Friday, just beneath that blue trendline. In the charts of other indexes that follow, you will notice other “push events” like this which took place in earlier weeks (or months) on different markets. The reversal didn’t stay intact as cleanly as I would have liked, but last time I checked, the market wasn’t very interested in what I liked or didn’t like.

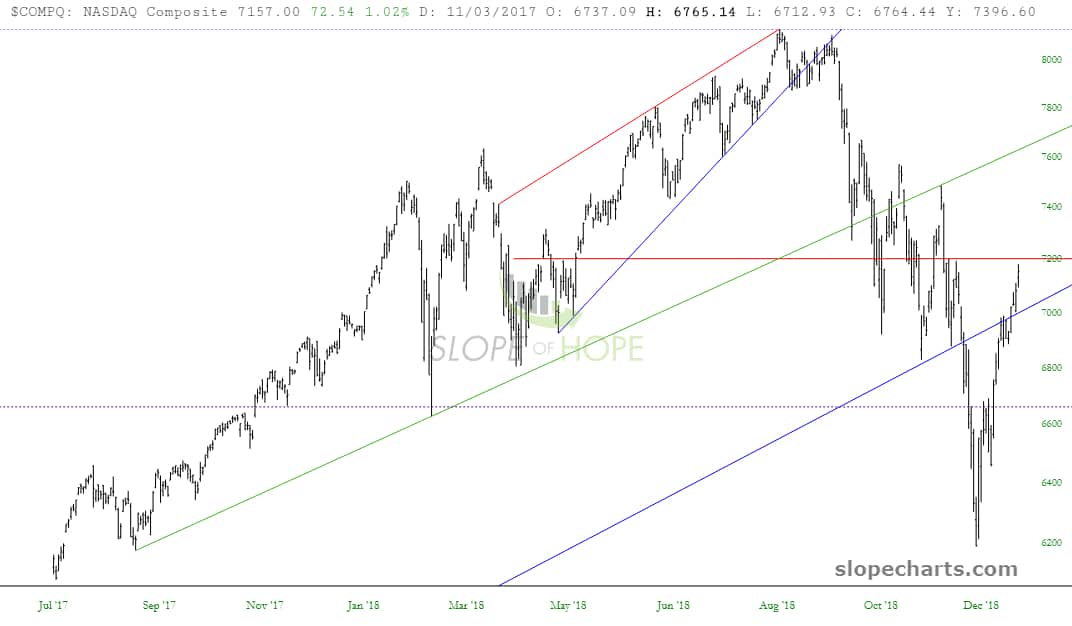
The NASDAQ Composite, just like every other index out there, is still in a series of lower lows and lower highs. That’s the good news for the bears (and I hope I’m not being too presumptuous in using the plural of that noun). The not-so-good news is that the market could still keep charging higher even within the context of “lower highs”, since the last meaningful instance was still quite a bit higher from present price levels.
I’ve augmented the Russell 2000 with the CCI, which shows how we’ve gone from “overbought” to “overbought-er”. Federal law does not prohibit higher prices, irrespective of the CCI, but it’s the best we’ve got at the moment. As you can see from the horizontal, this index was also “violated” (pretty much everything was in the latter portion of this week………….) so we no longer have our squeaky-clean reversal top. Not even close.

In an effort to throw the bears a bone (do they eat bones? I don’t think so……..) below is the Broker/Dealer Index, which beautifully tagged its descending trendline at Friday’s high. If this week has proved anything, it is absolutely possible for a financial instrument to make a terribly rude physical gesture at its trendline and go marching right past it. But, hey, at least we haven’t yet on this one.

In a similar vein, the cousin of the broker/dealer index – – the XLF financials – – we are just a cat’s whisker away from its 50% retracement. The strength from banks has been incredible, but perhaps they’ve exhausted themselves. We’re not going to find out until Tuesday.

As for my own portfolio, I remain in “participating but not really dedicated” mode. I have a mere 38 positions and a 115% commitment level. We are officially into the 4th week of this monstrous rally, and I’ve definitely lost a lot of the old Tim-mojo.
