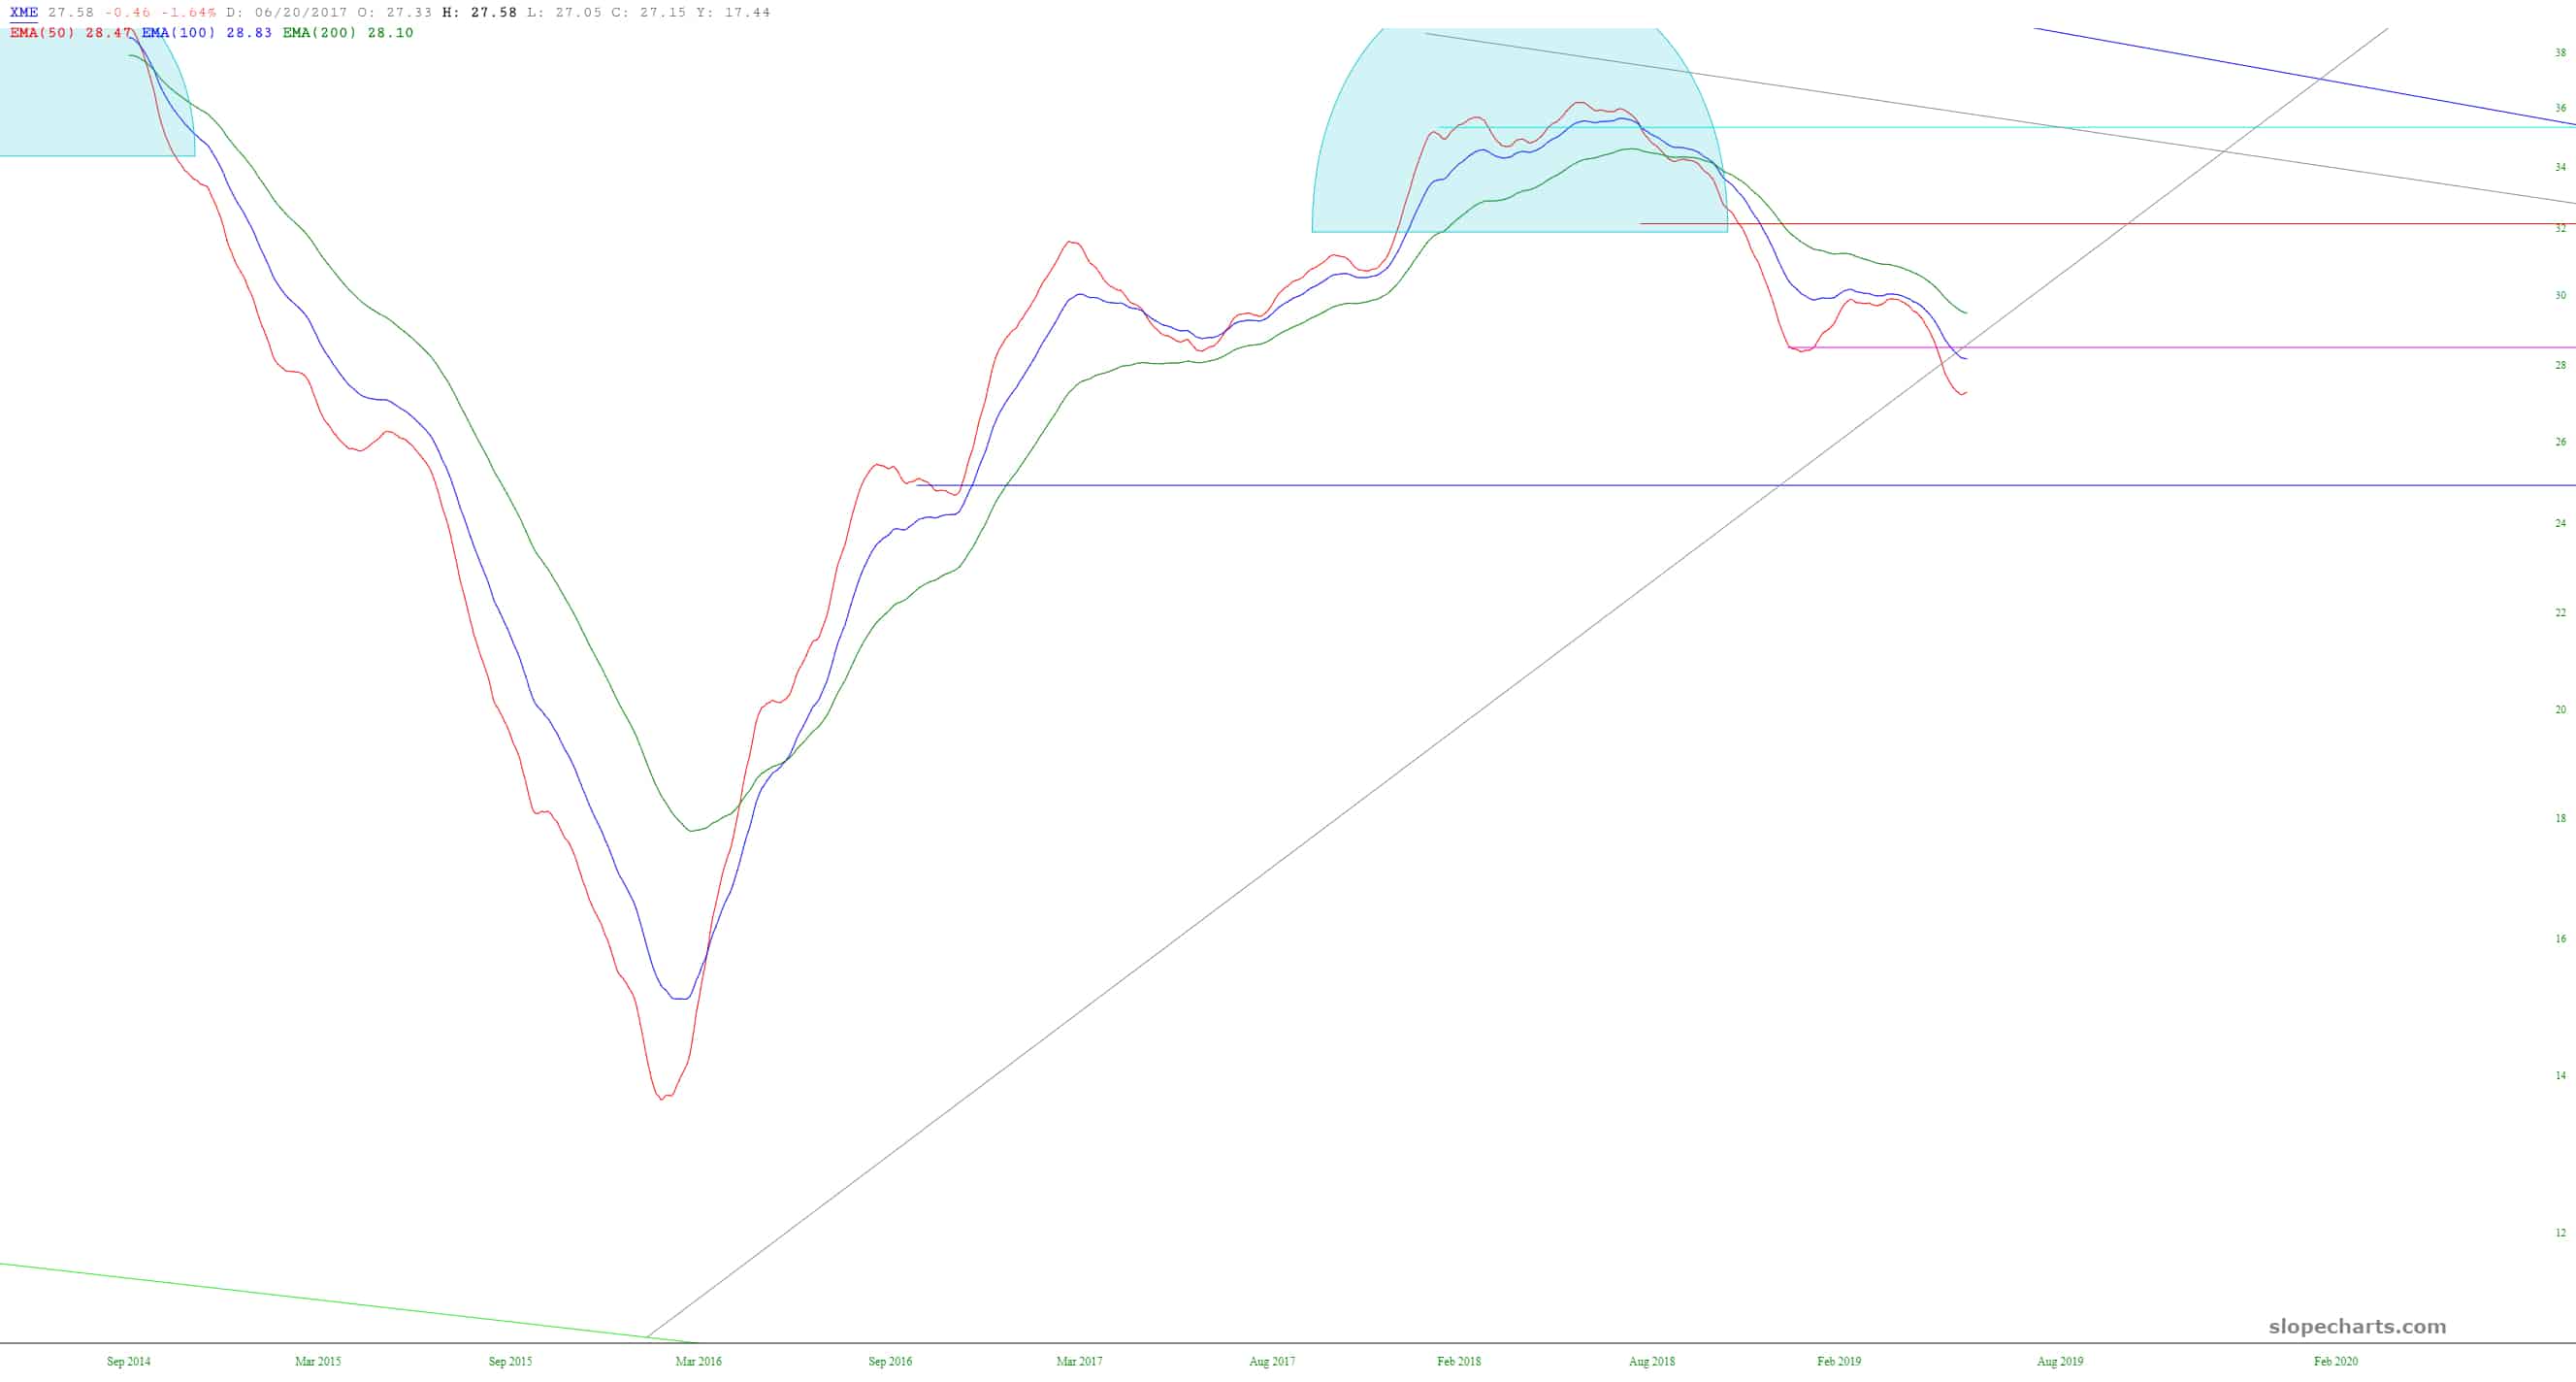
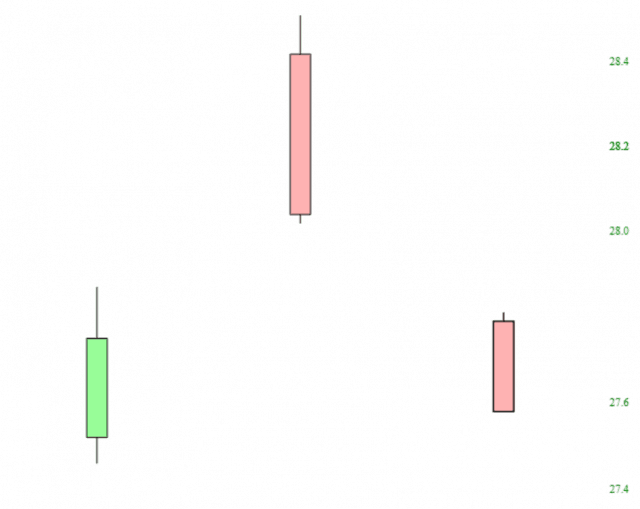
There has been an interesting reversal pattern with the metals & mining fund, symbol XME. This island reversal was intriguing enough for me to add to my existing short of XME with an updated stop-loss price of 28.05:
SlopeCharts has the ability to “stretch” into the future so you can see more white space on the right side of the chart. I’ve used this here to illustrate what I think is the future projection.
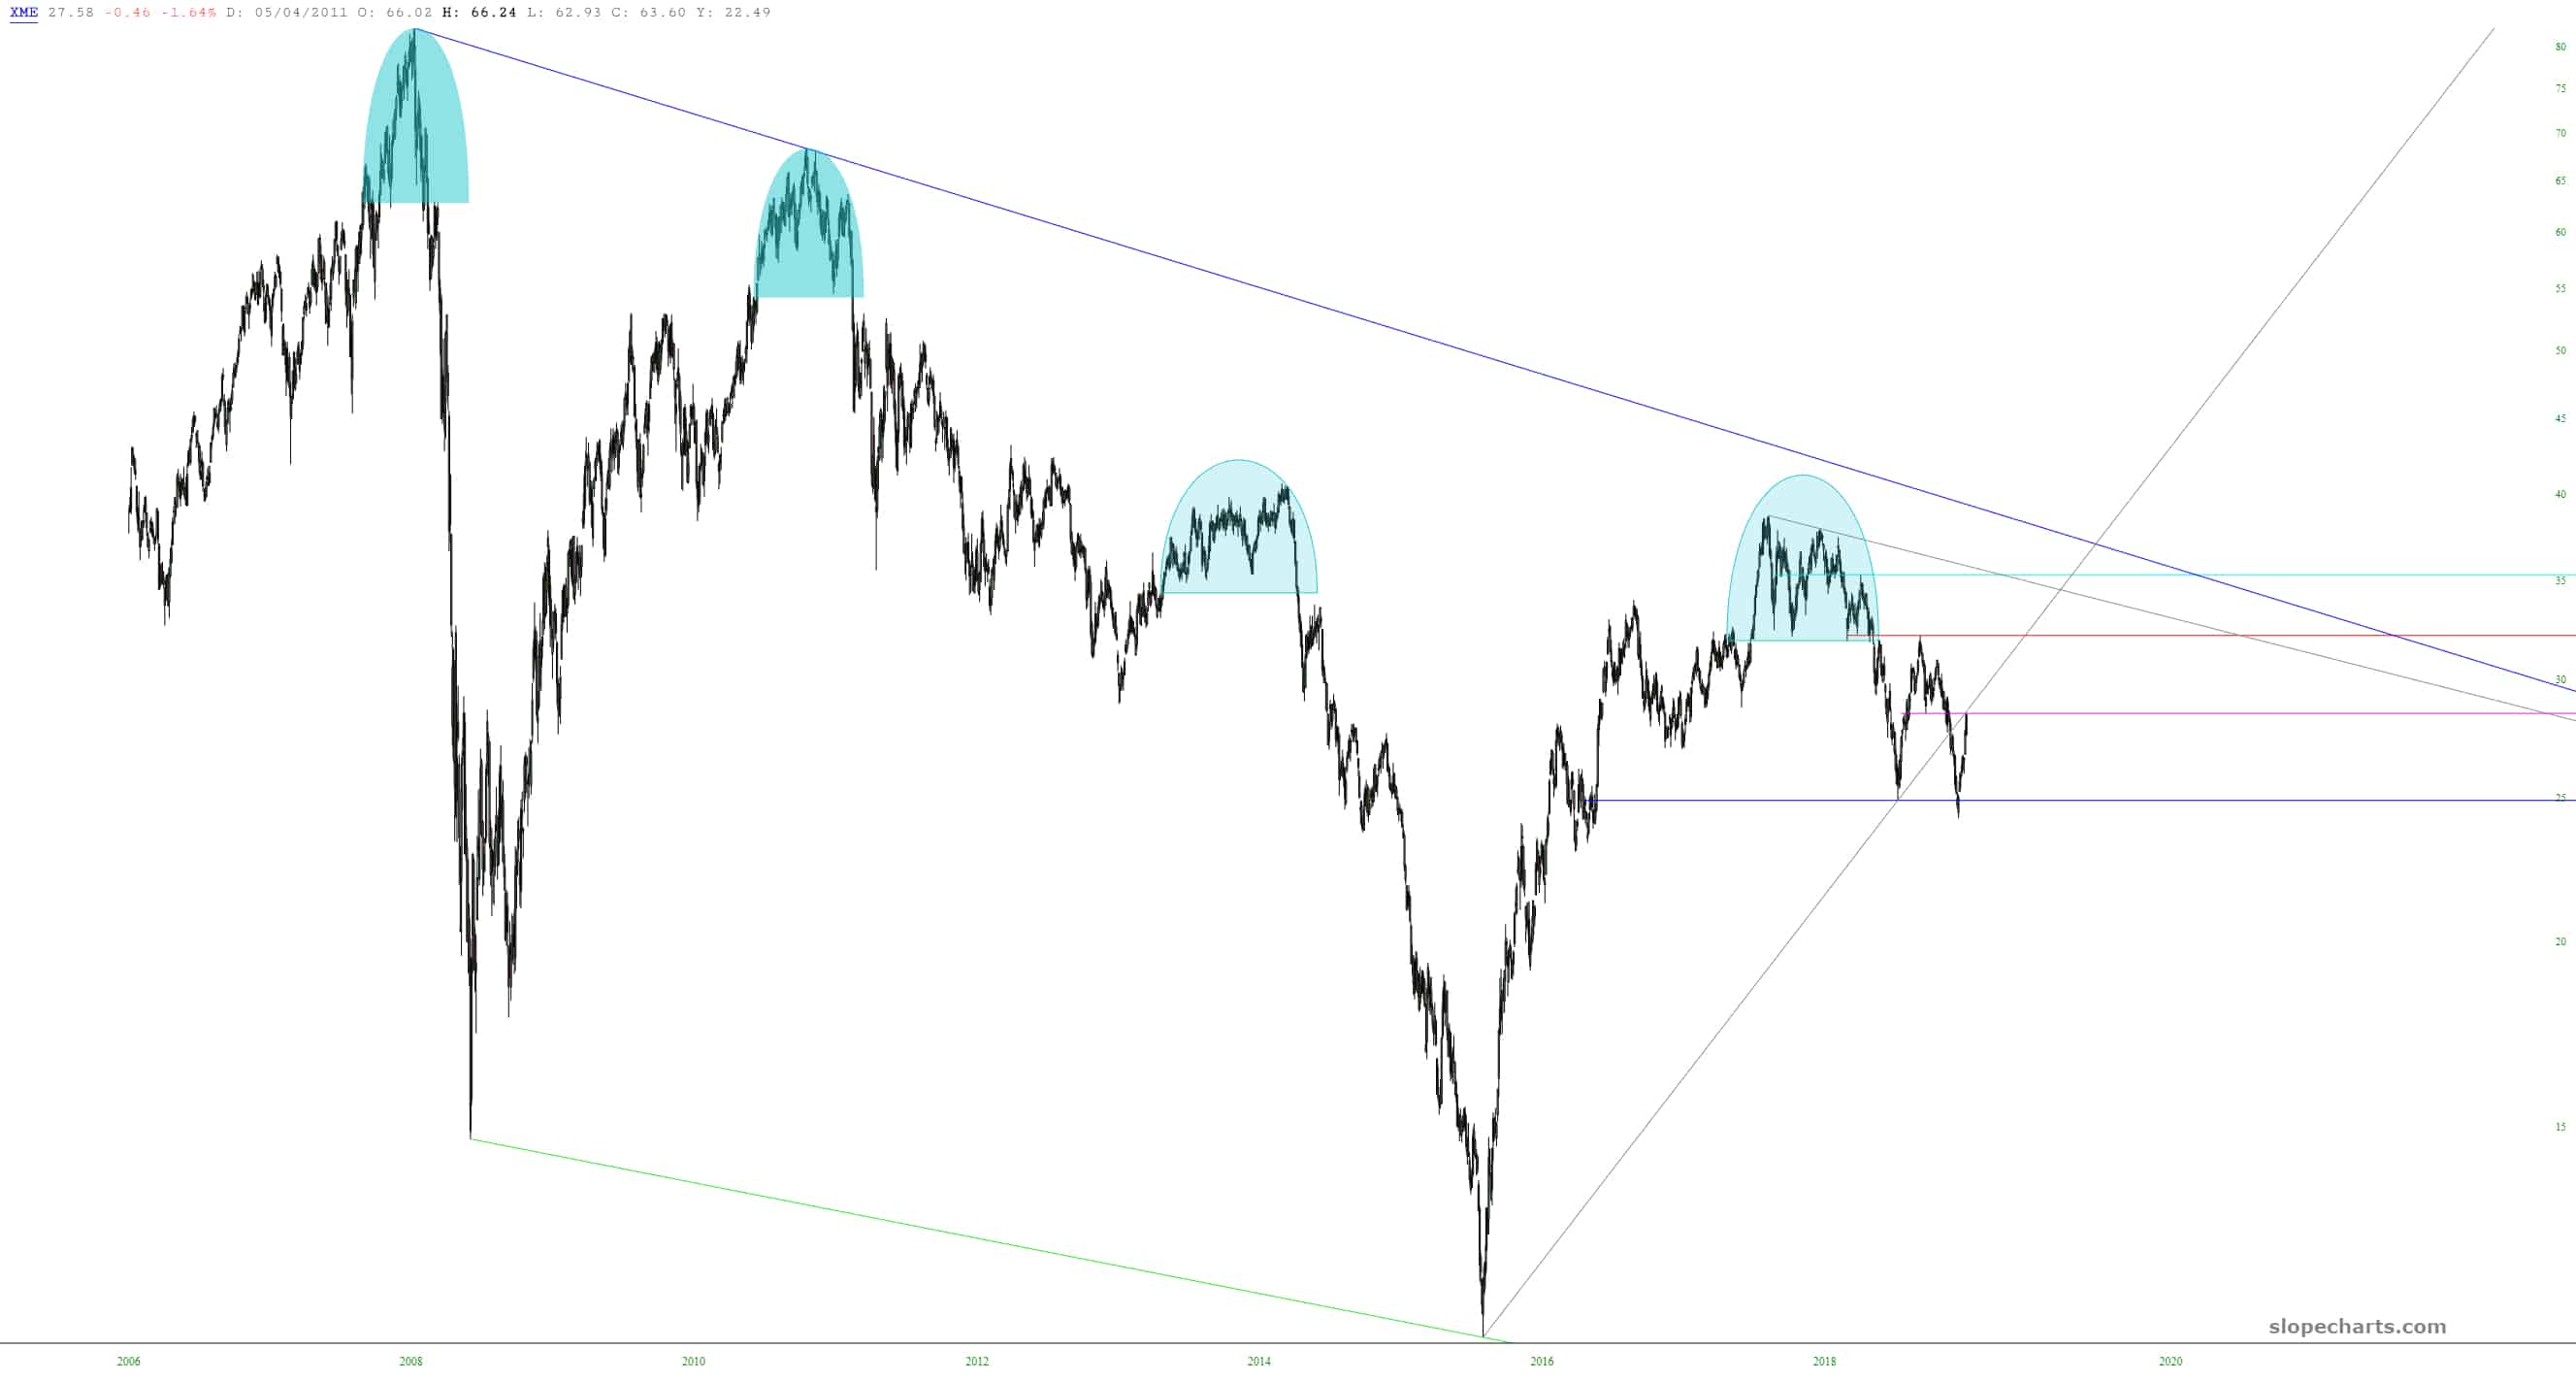
Stripping away the price data, and zooming in, I hope my case is made more plain: