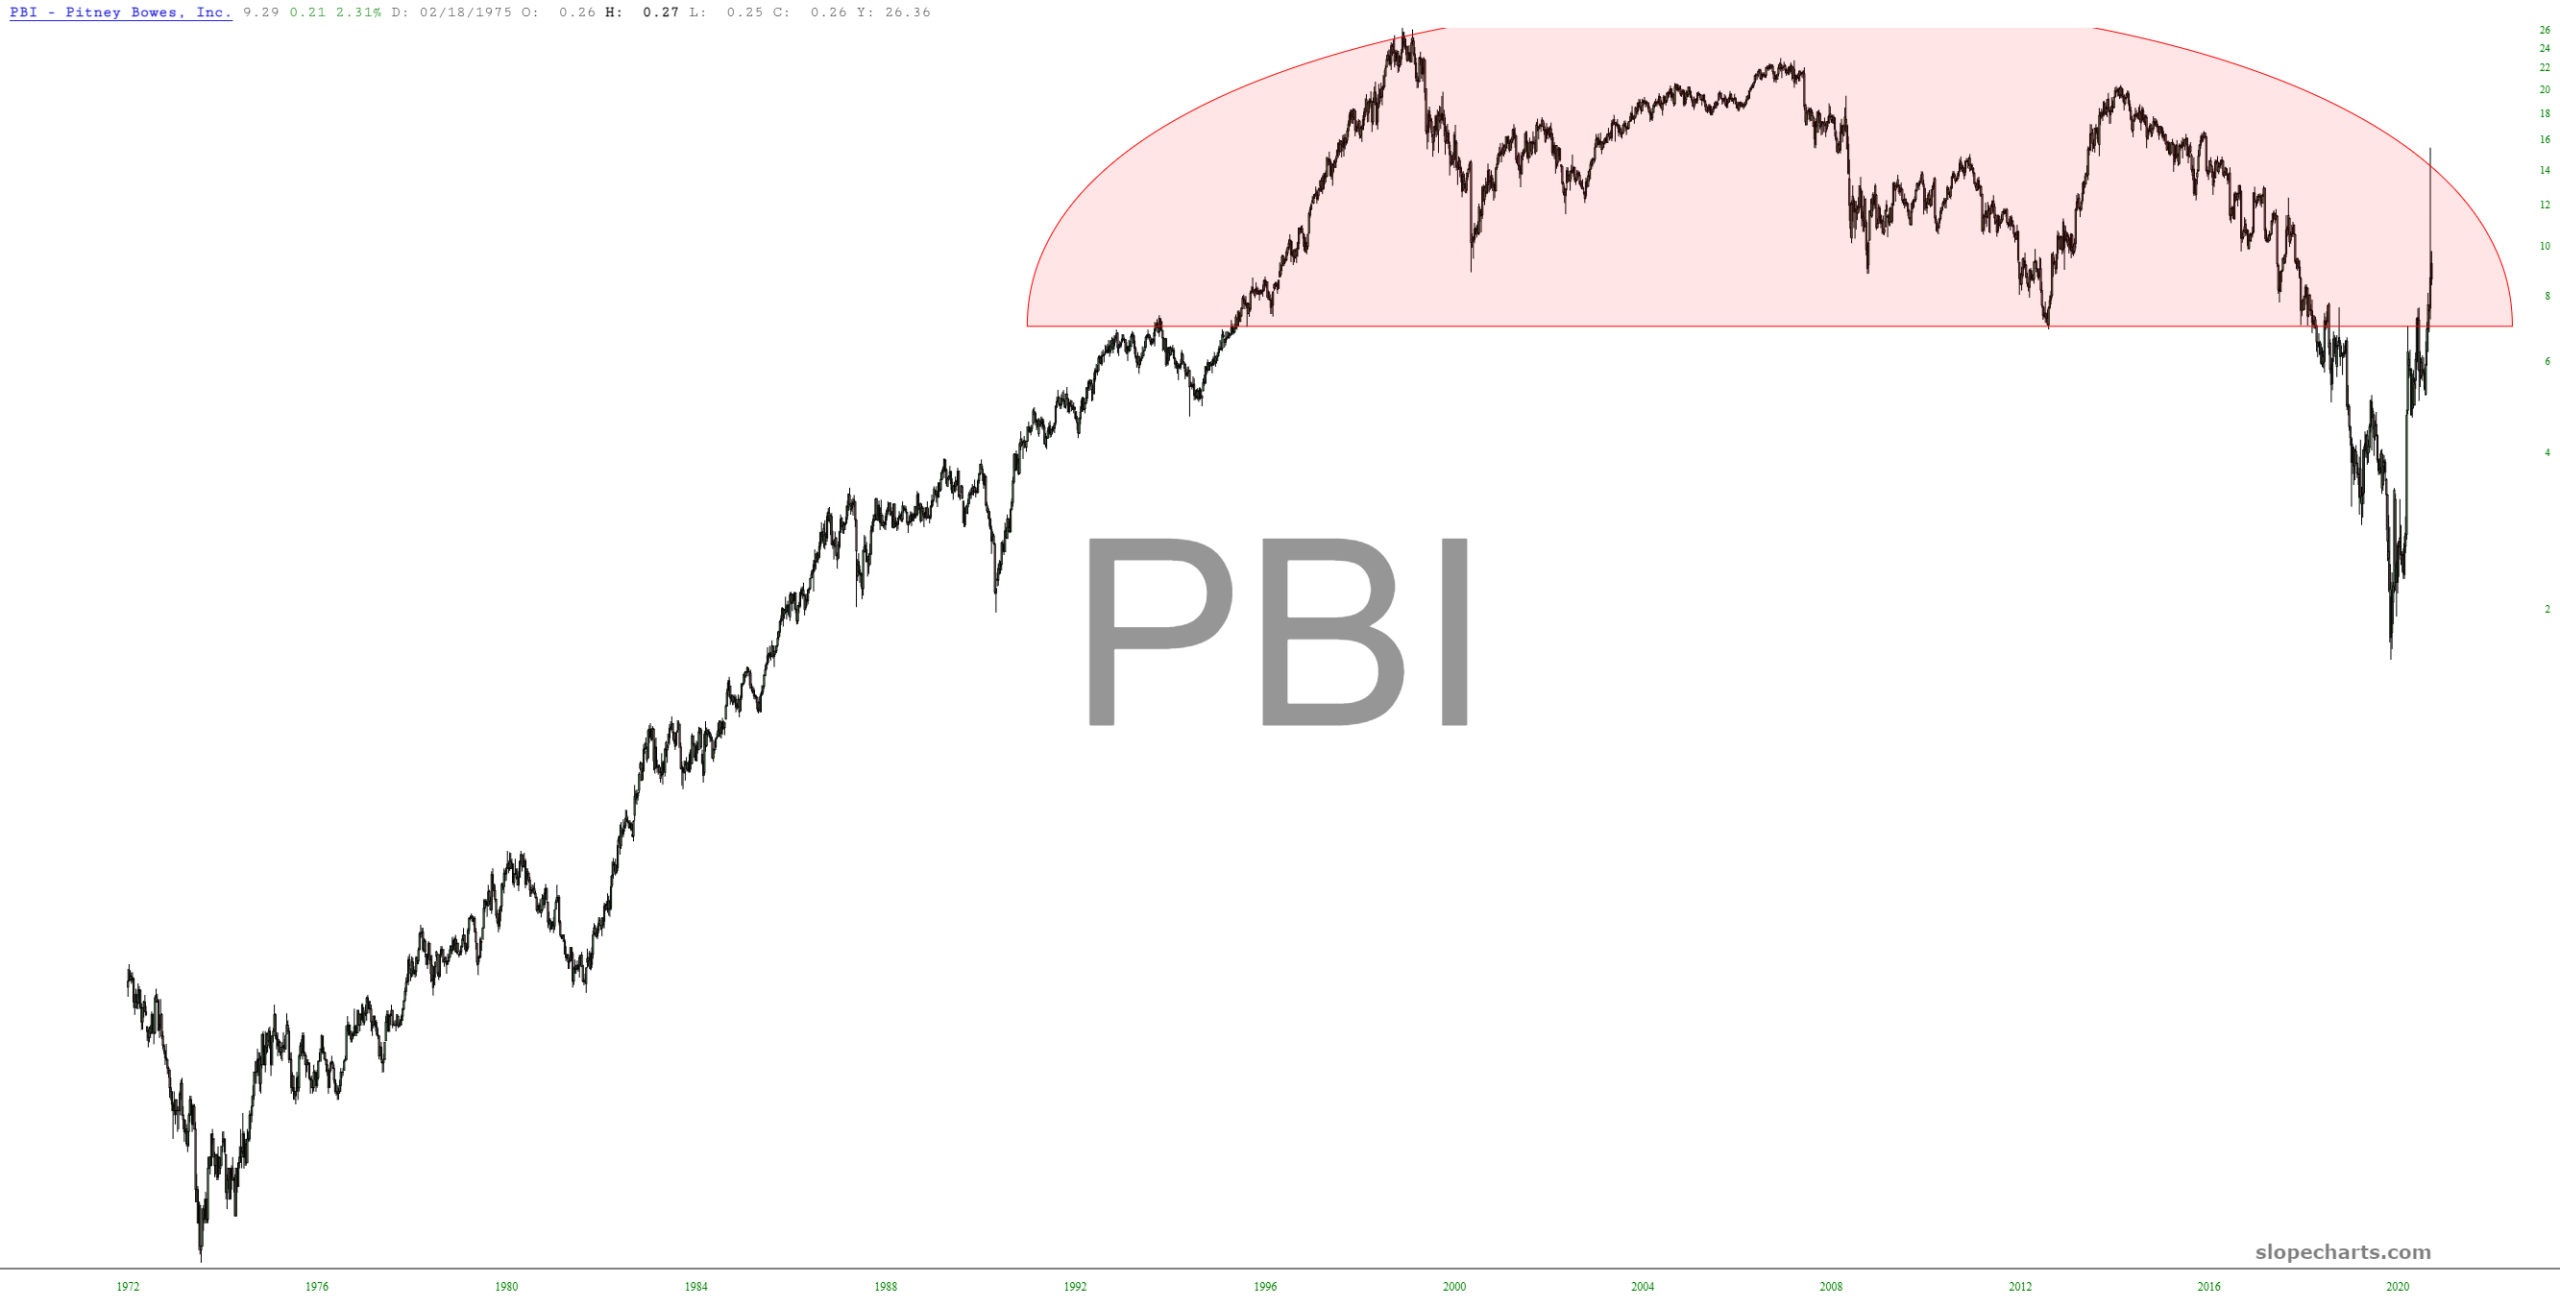
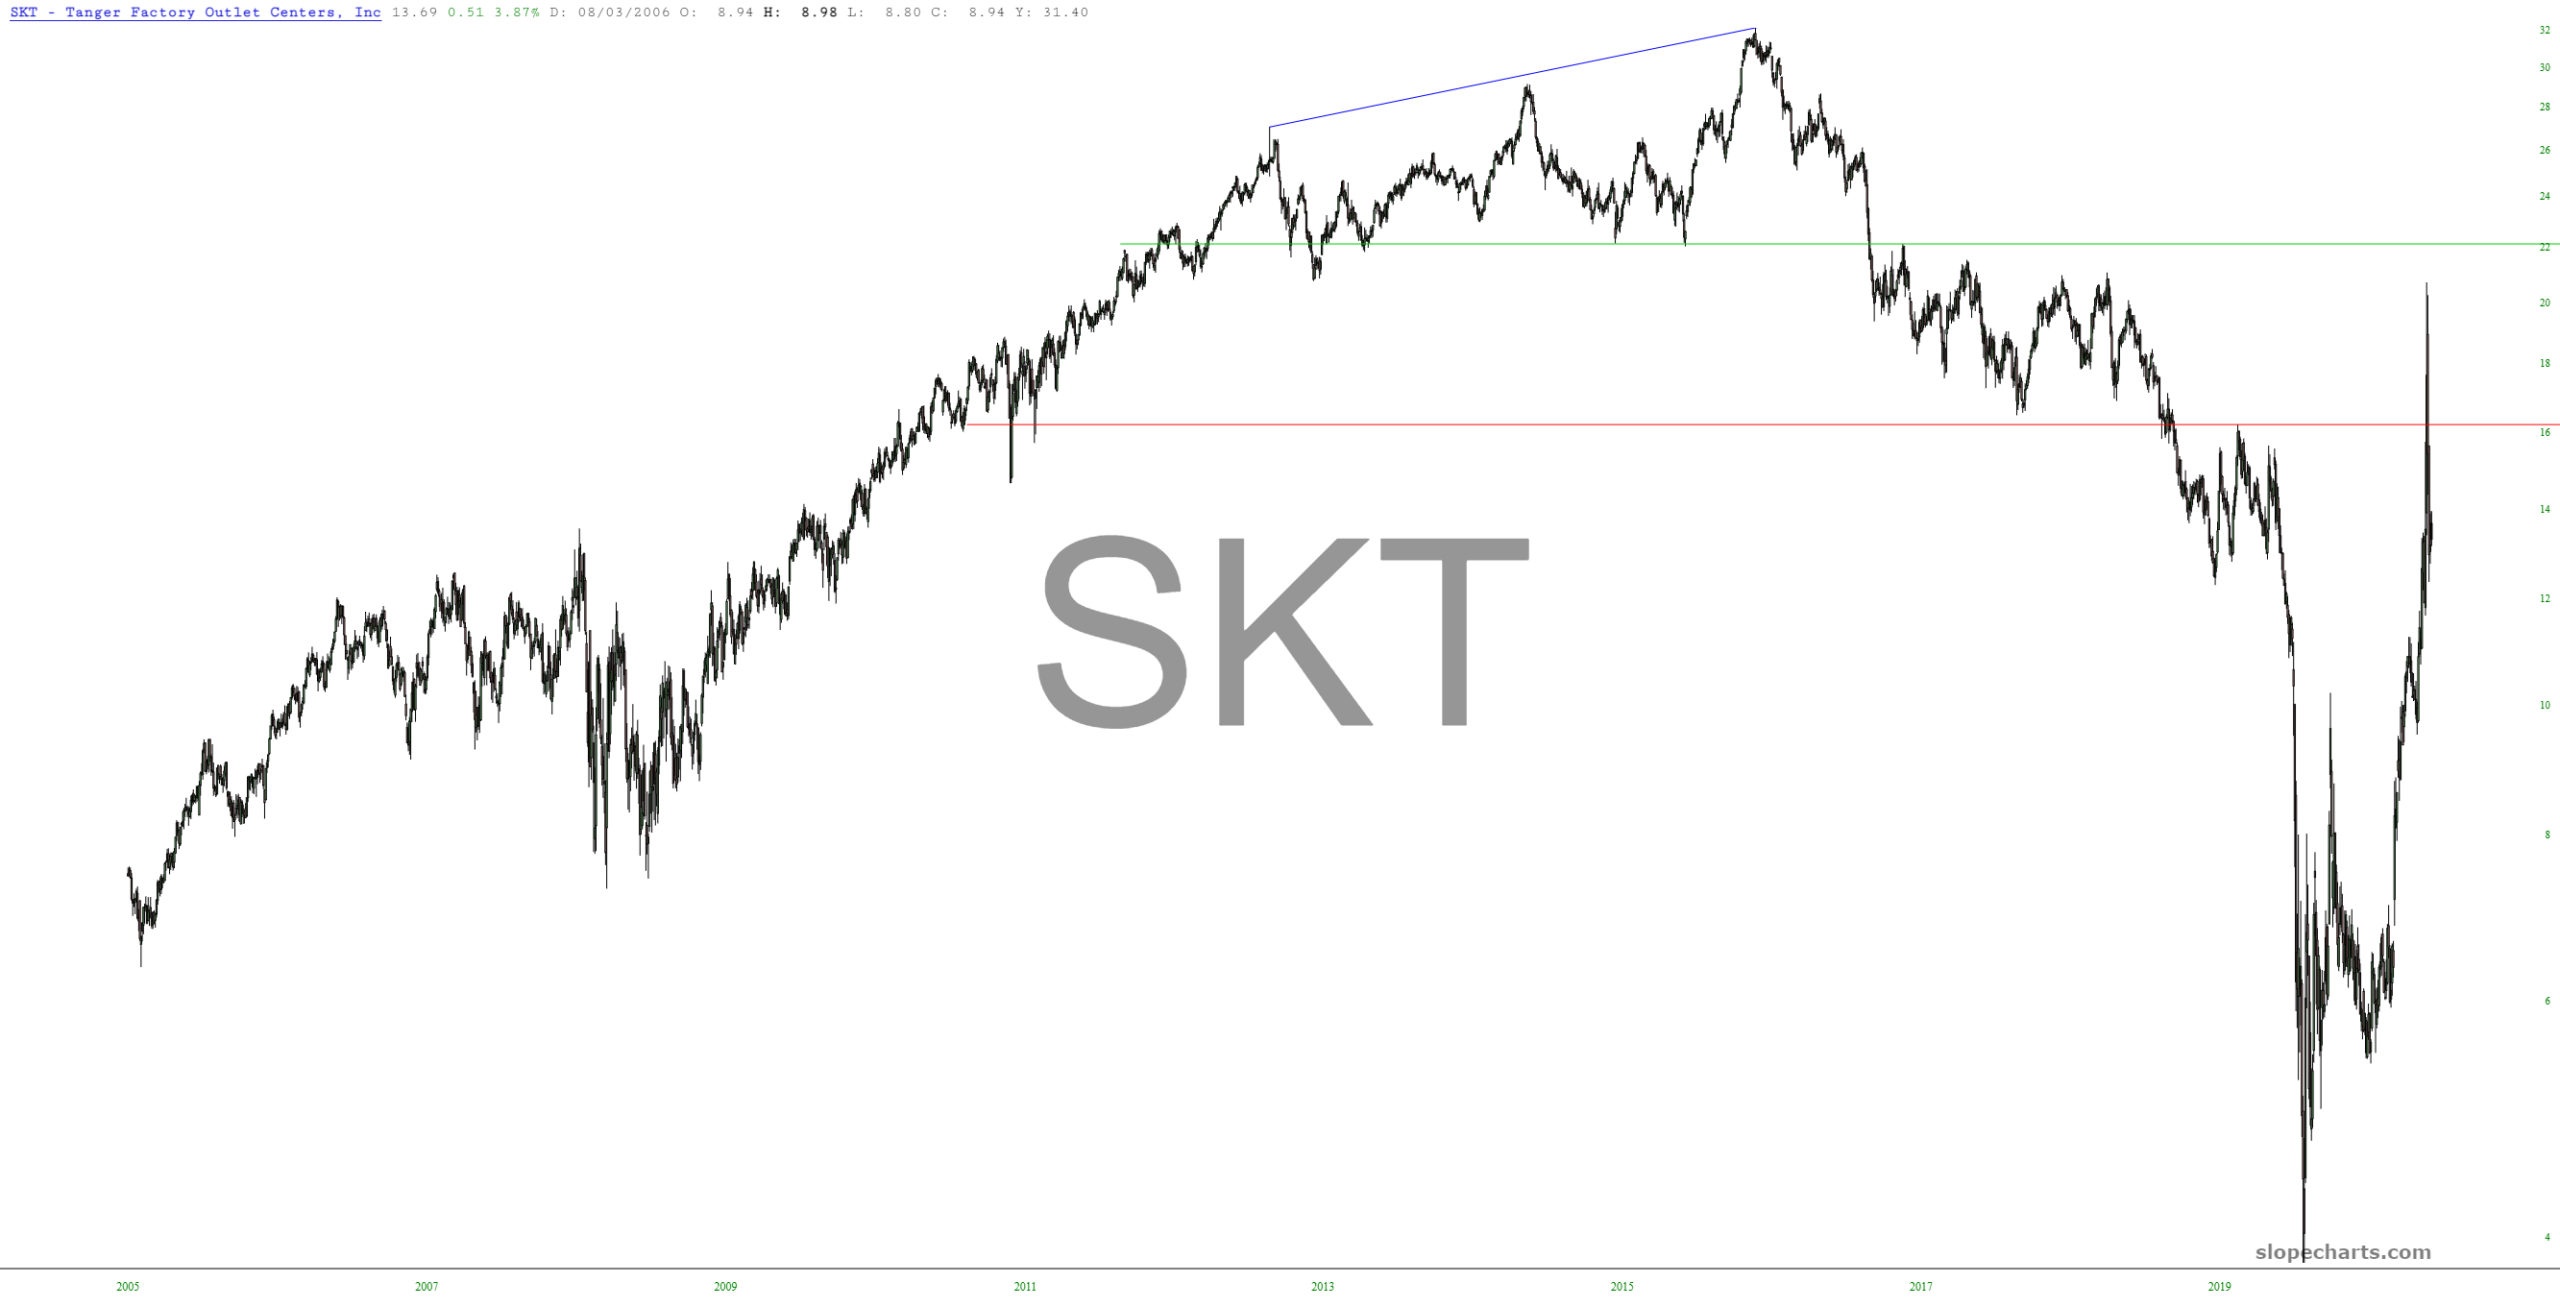
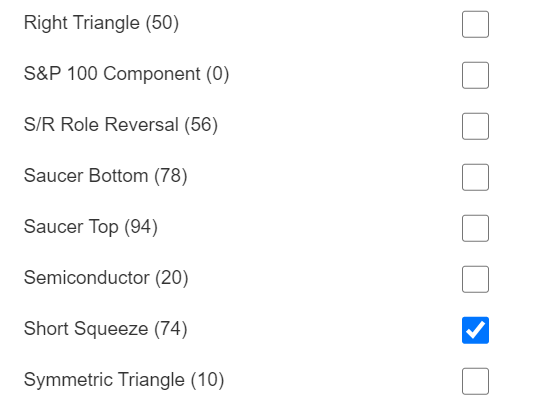
For this post, I used the Filter by Label feature to hone in on the stocks that have recently been subjected to the once-in-a-lifetime short squeeze we witnessed in recent days.
![filterby](https://slopeofhope.com/wp-content/uploads/2021/02/filterby.png)
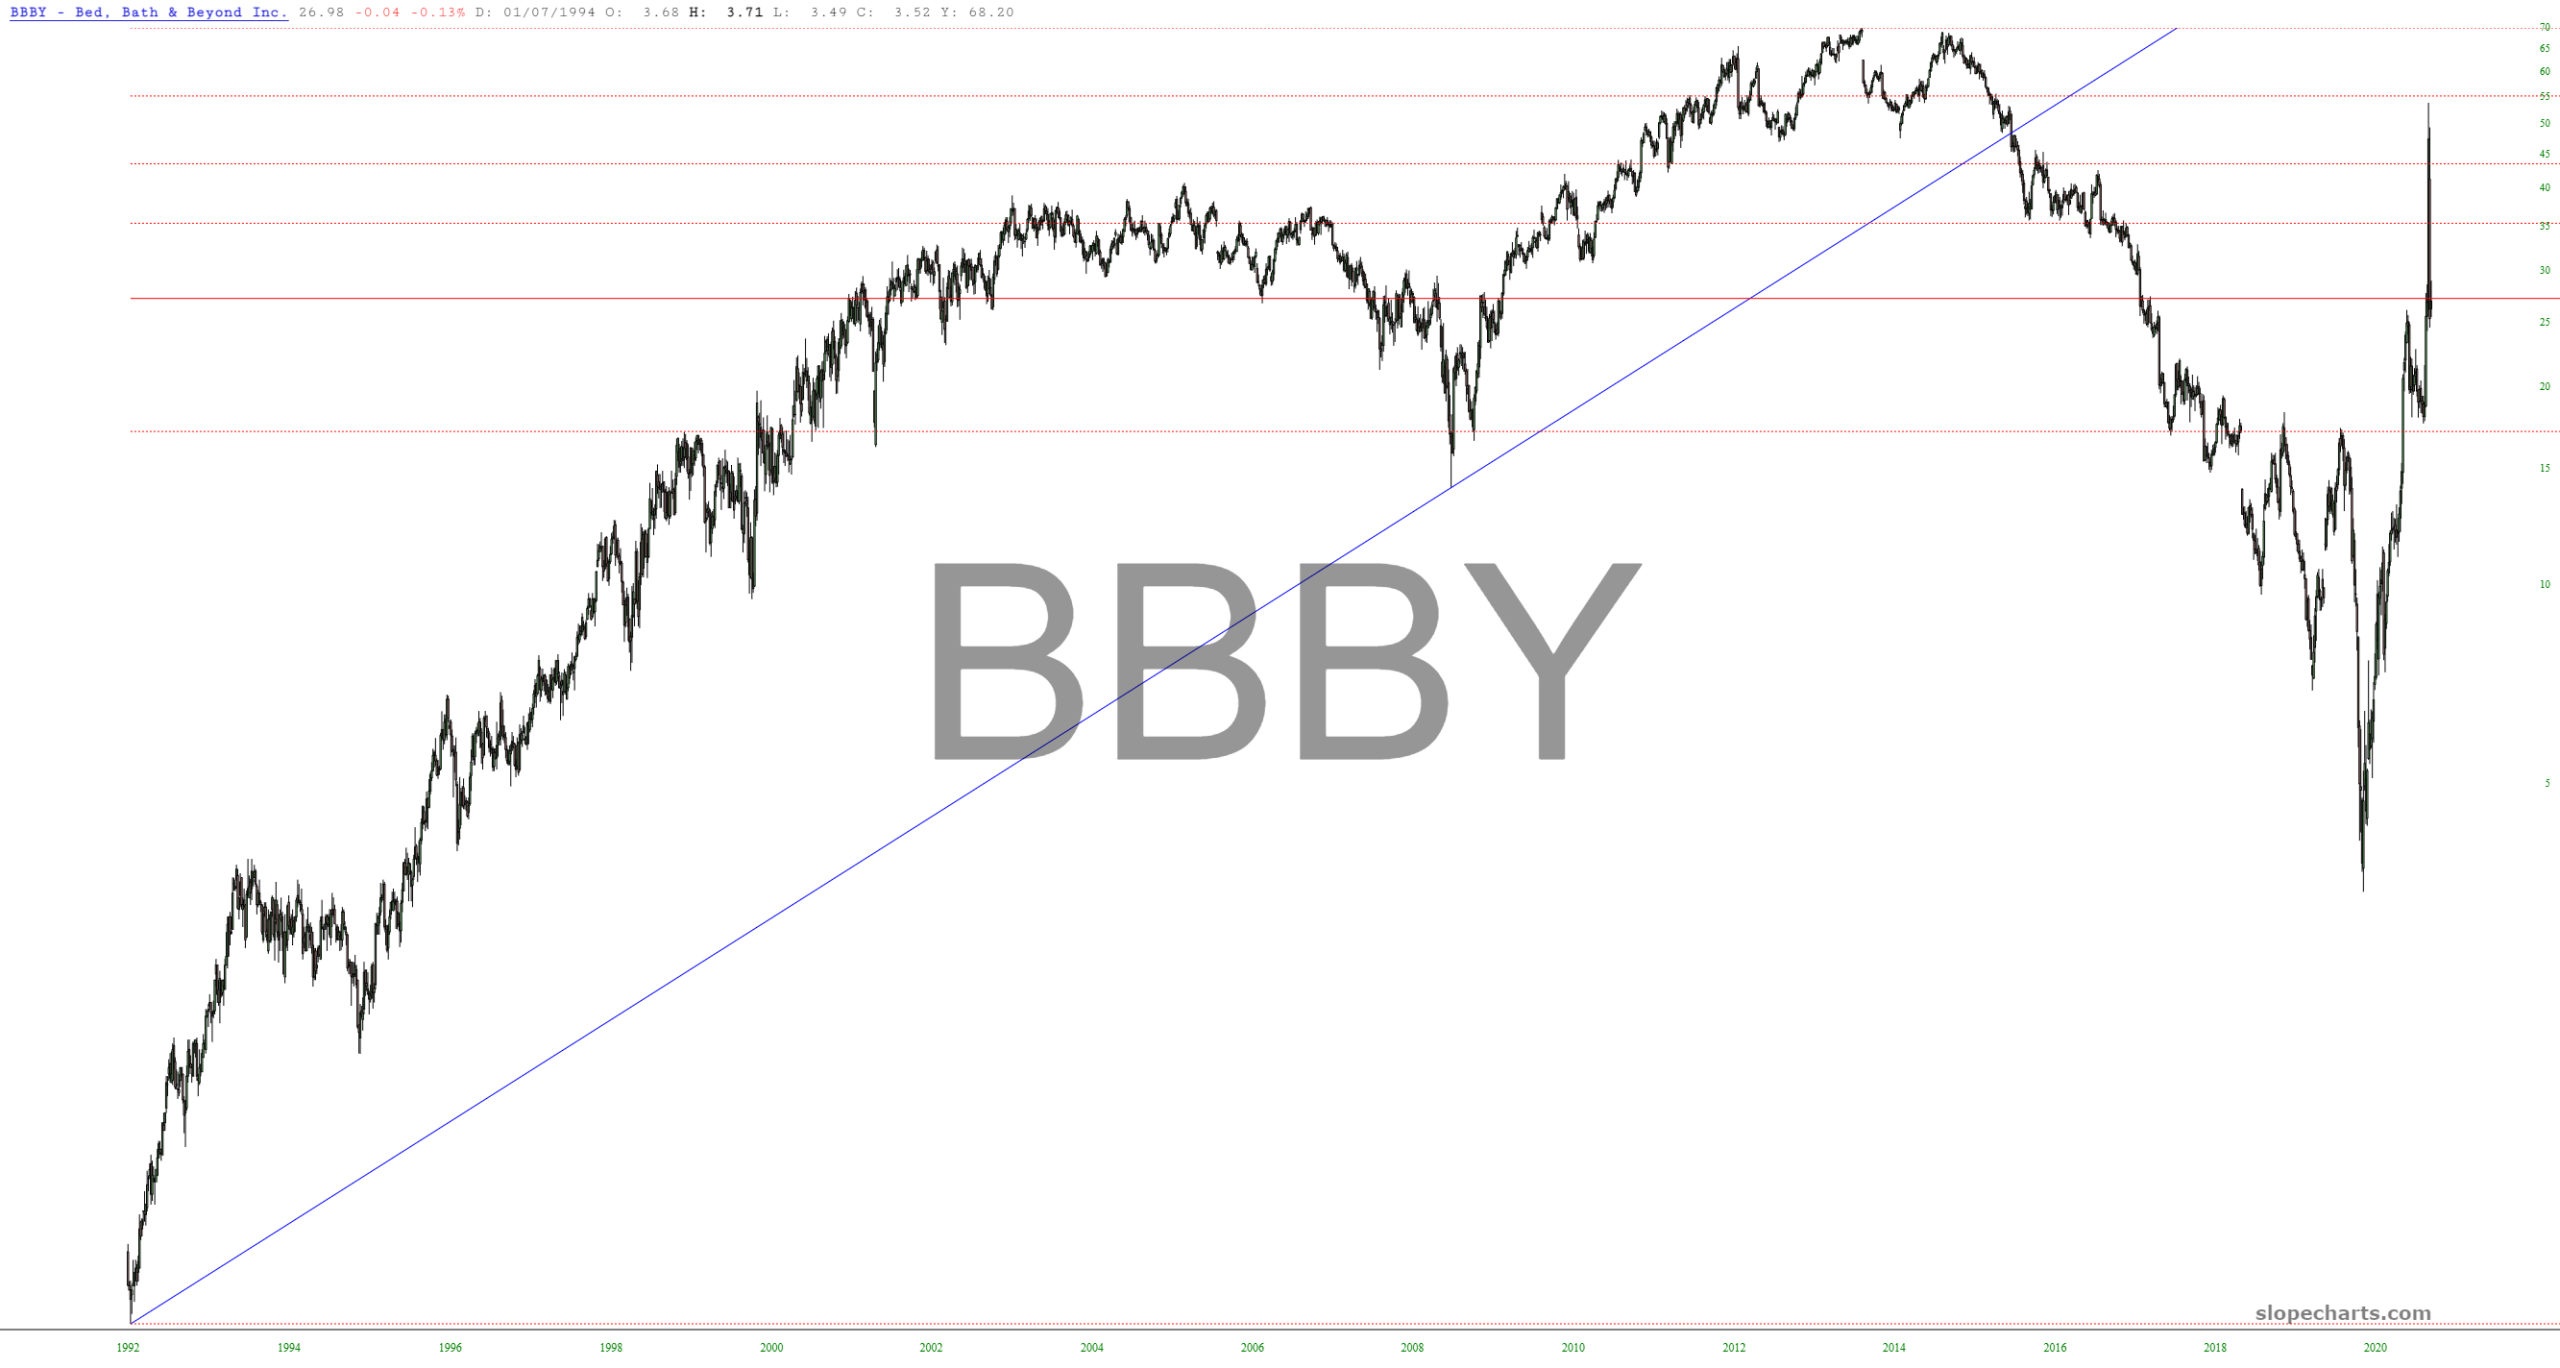
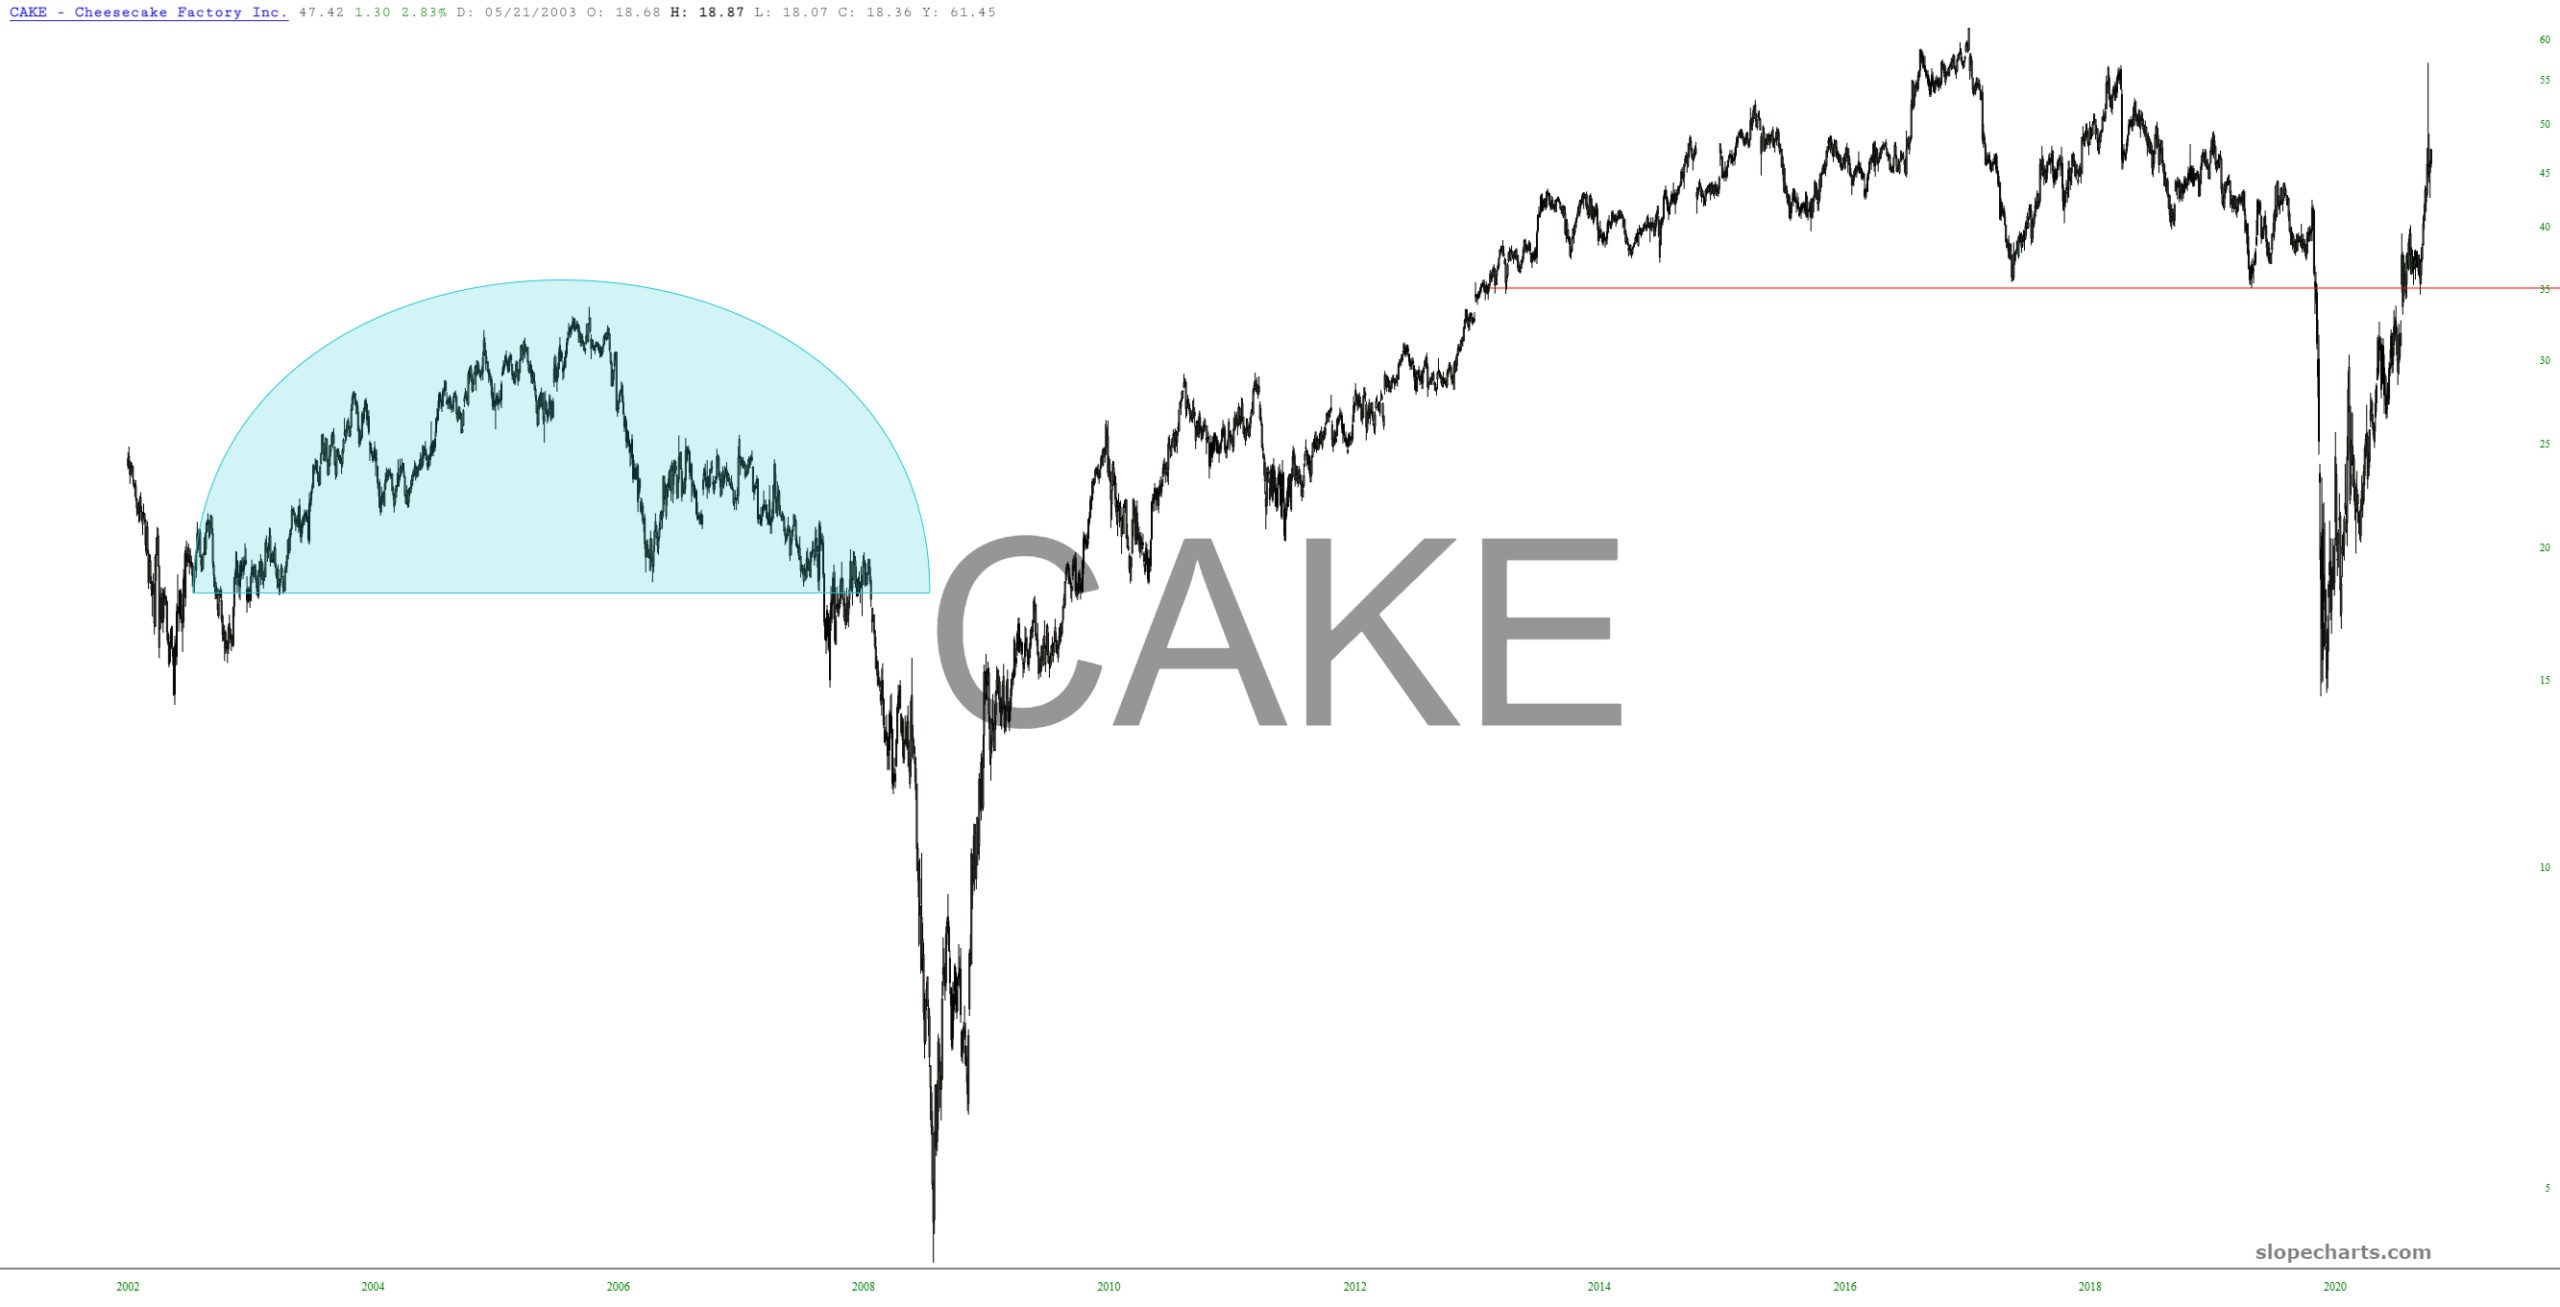
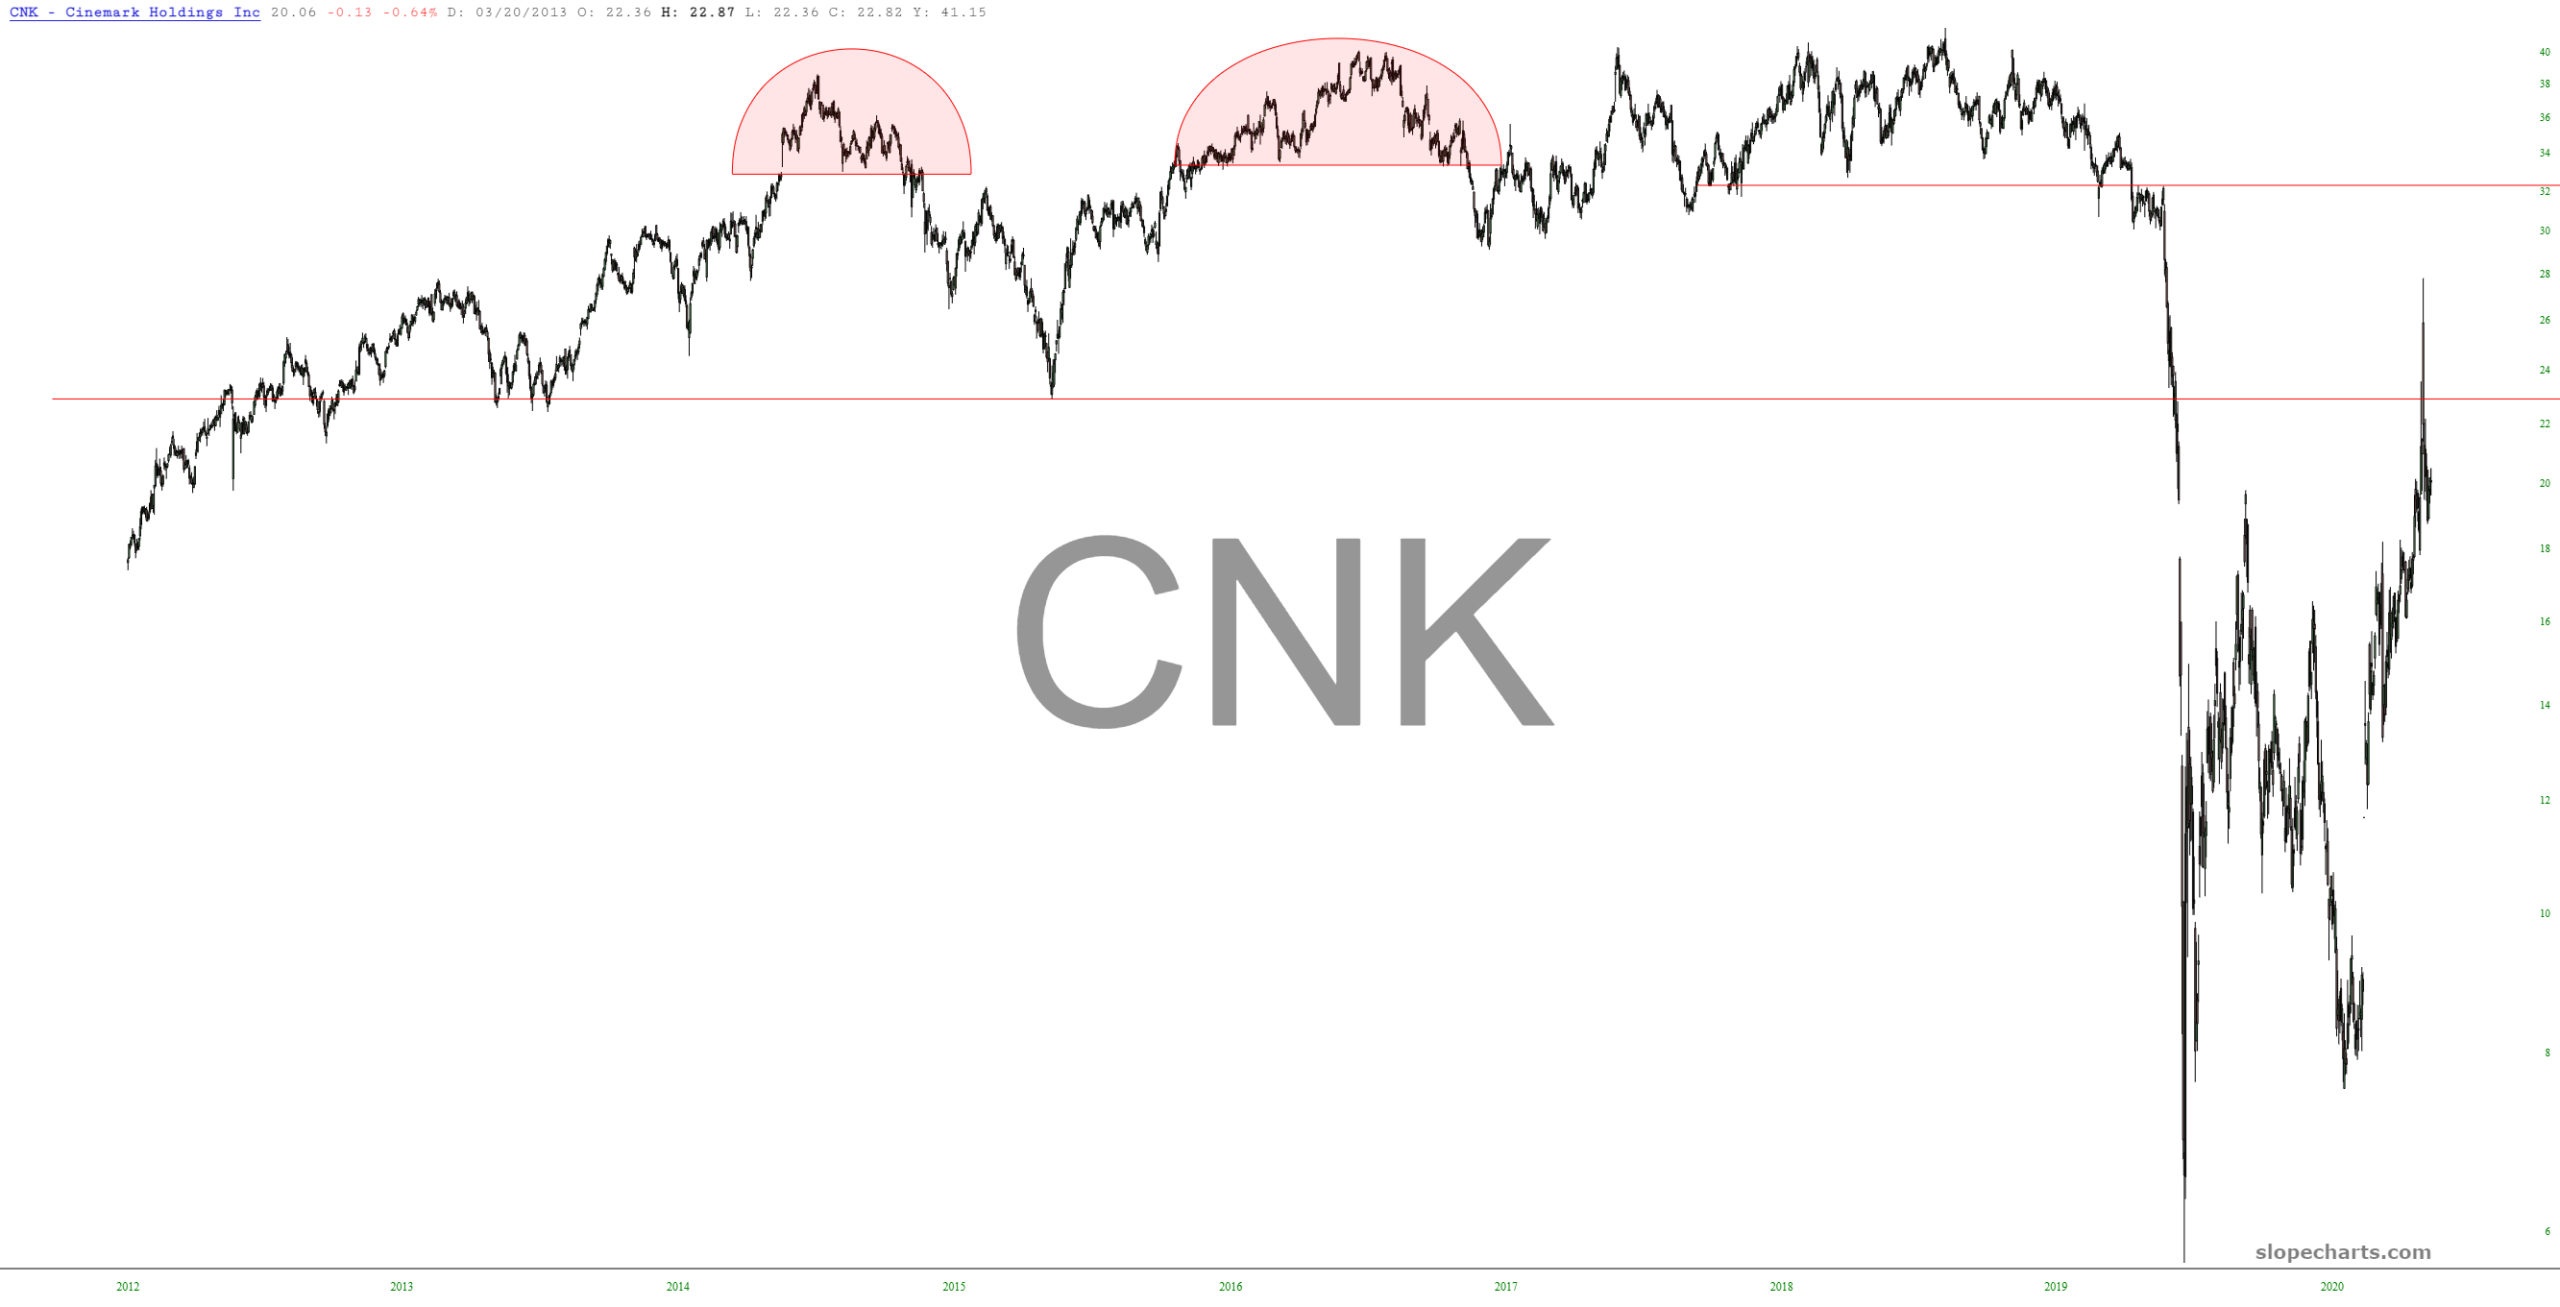
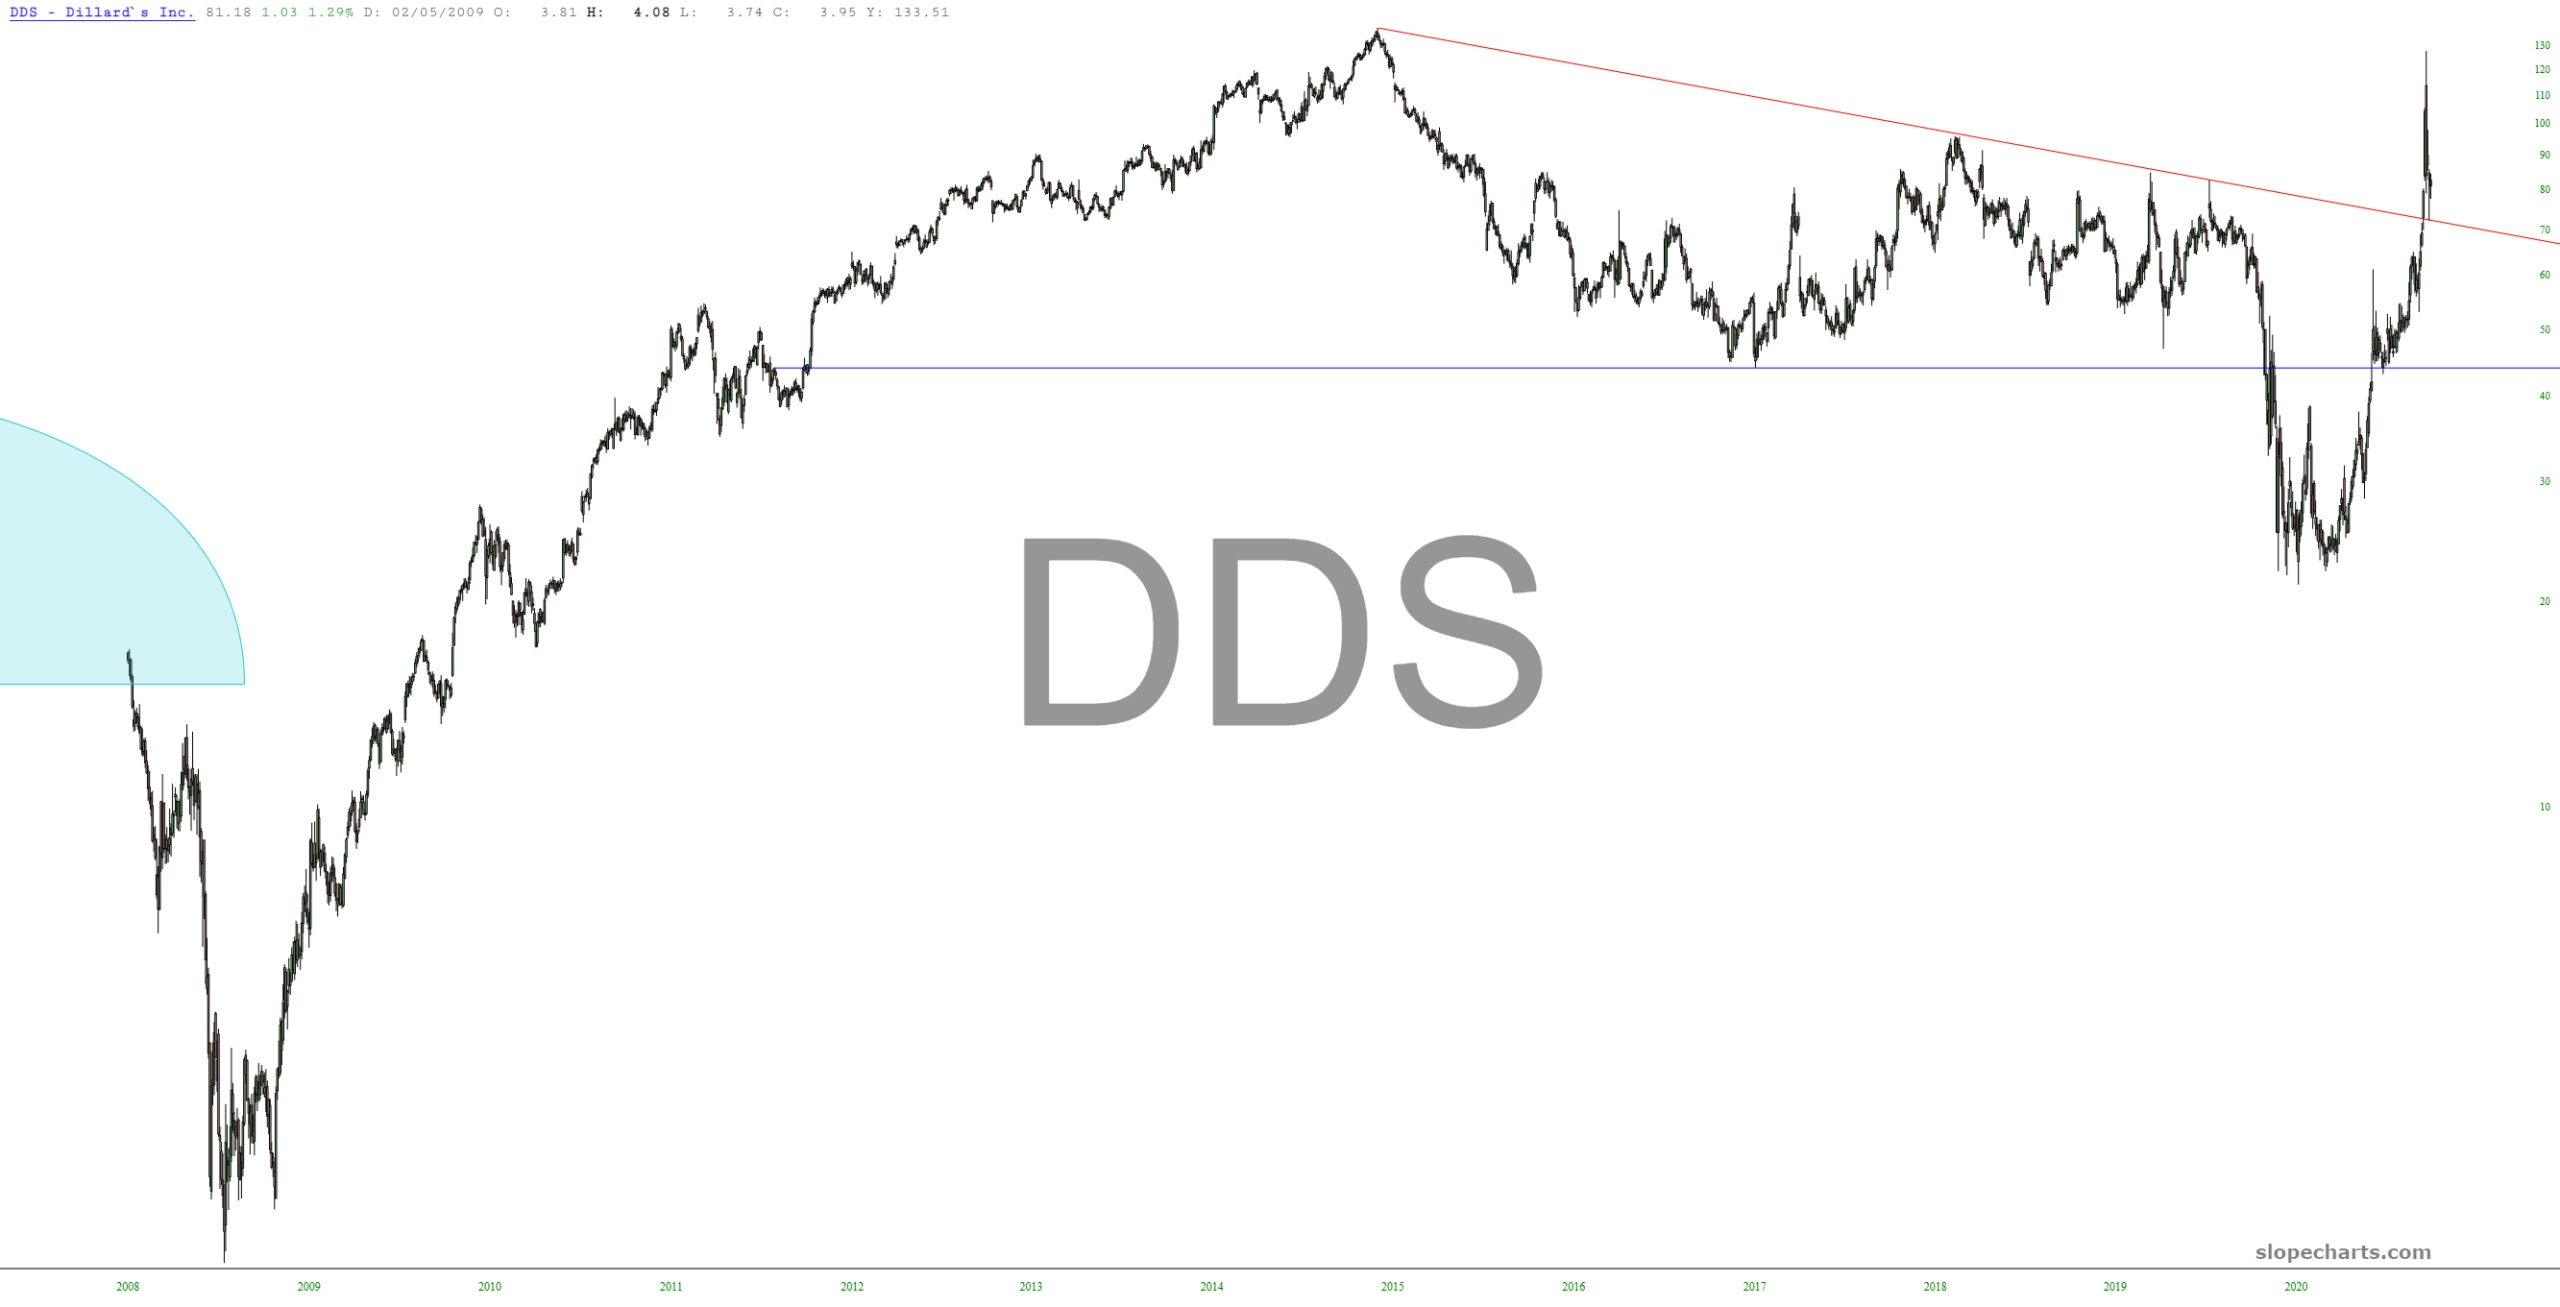
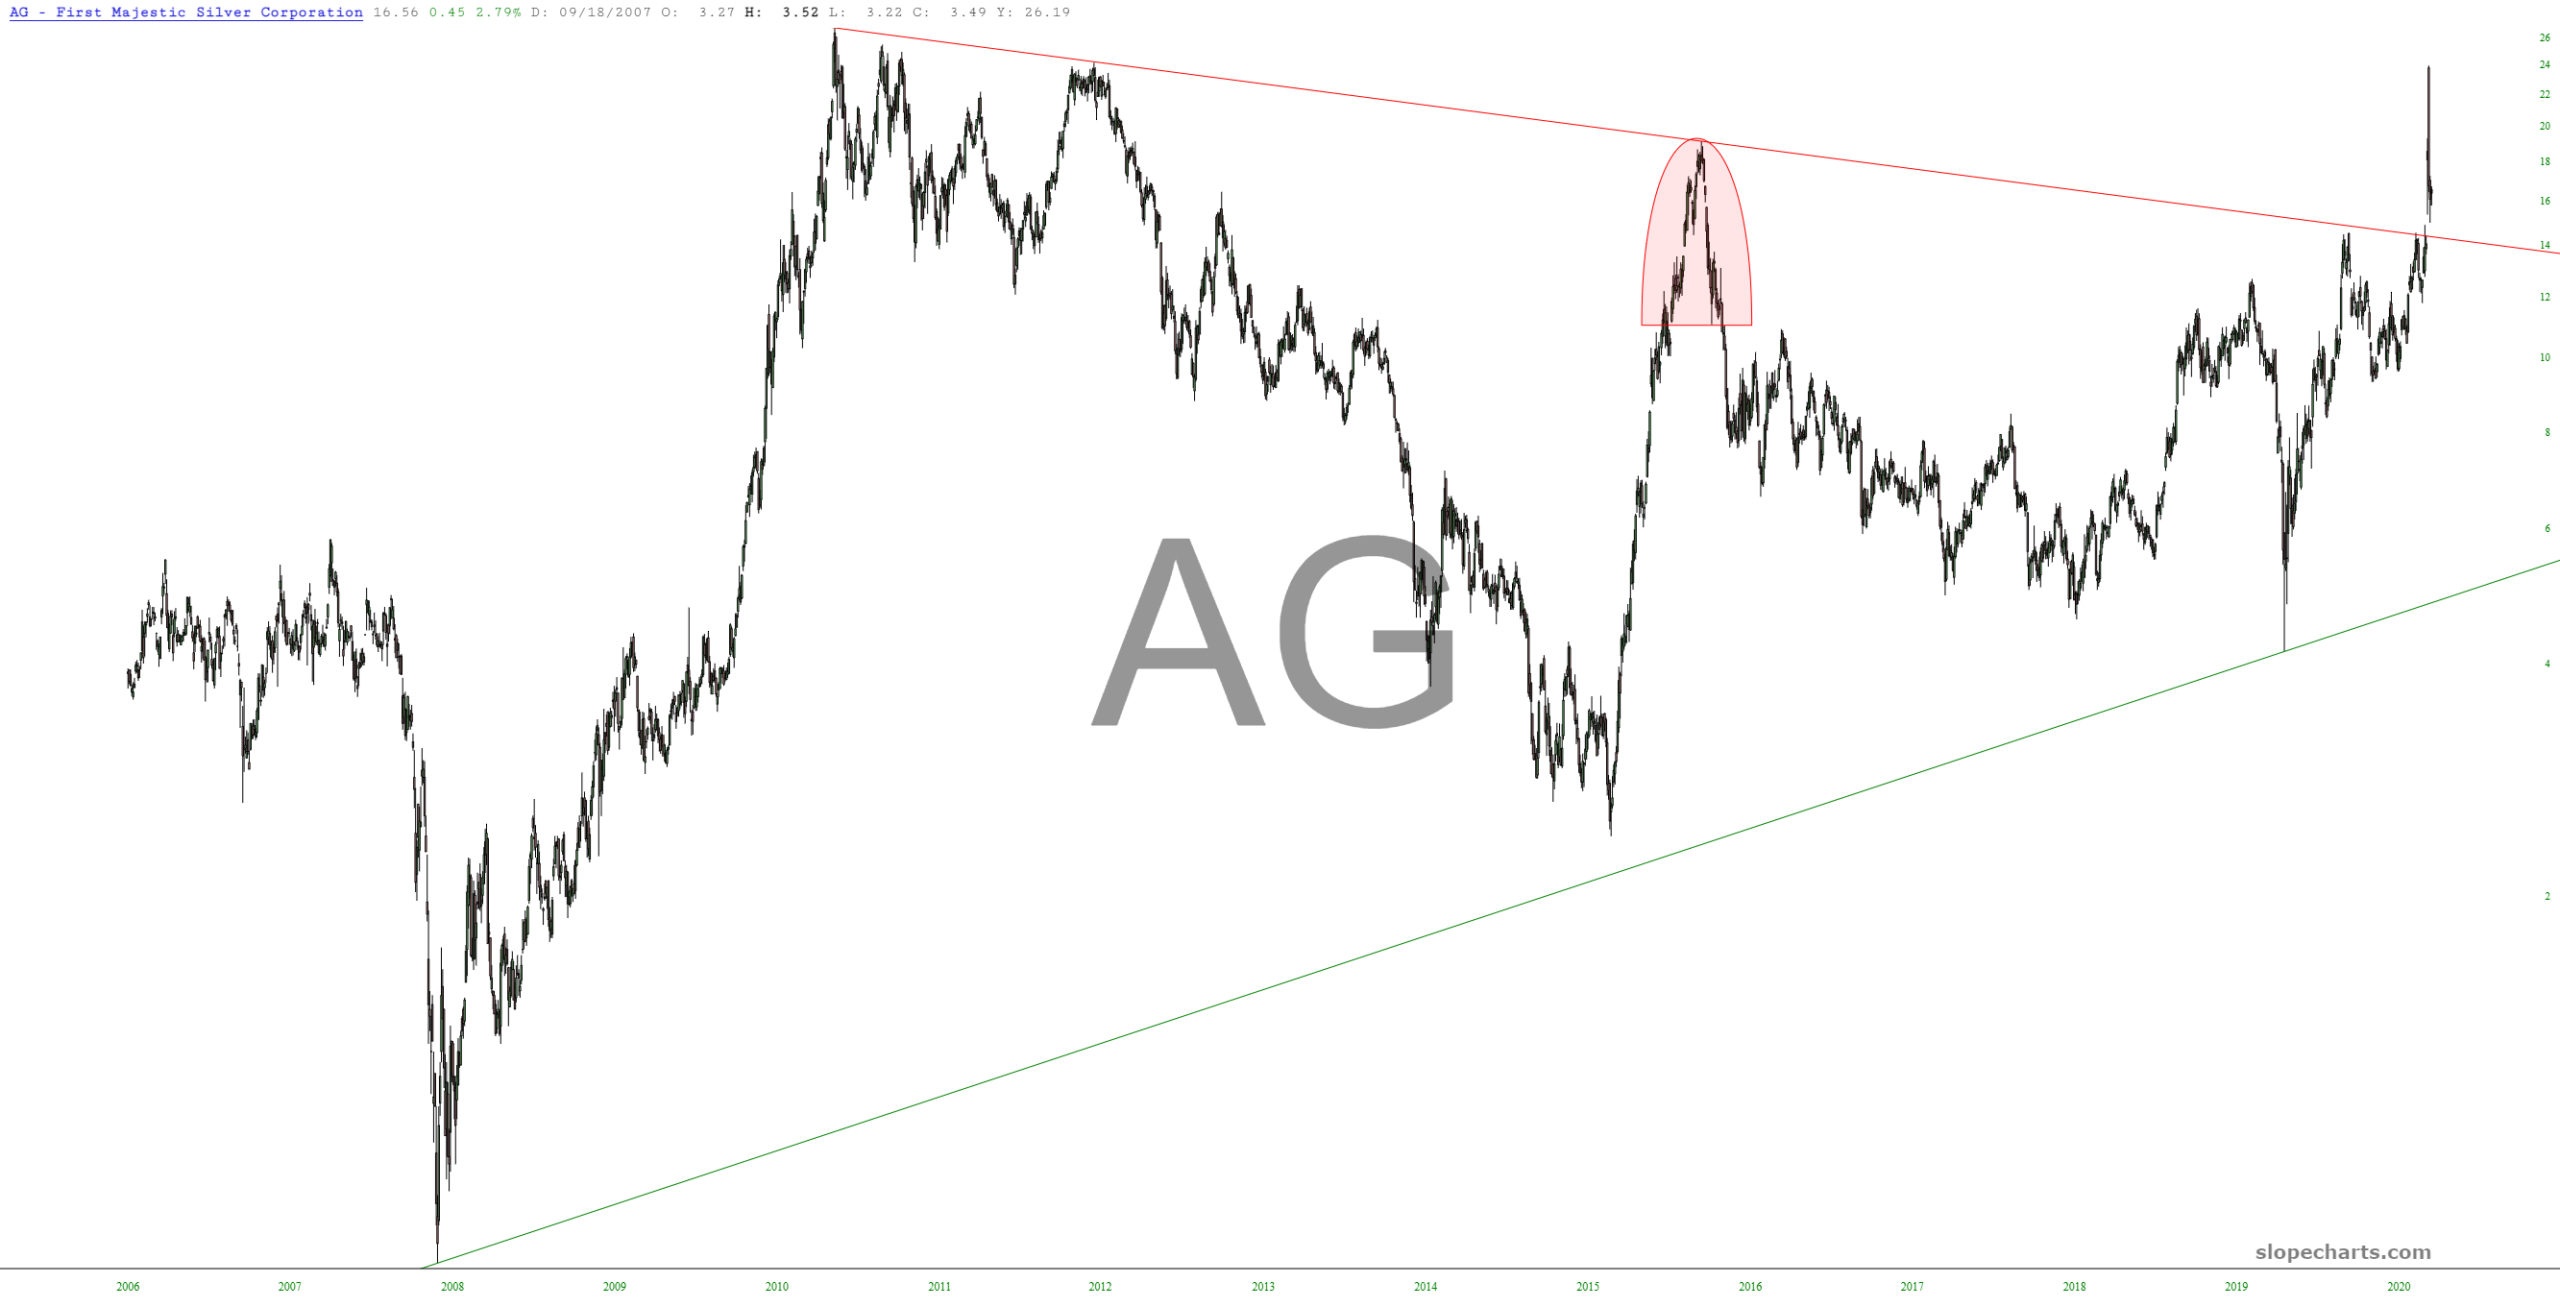
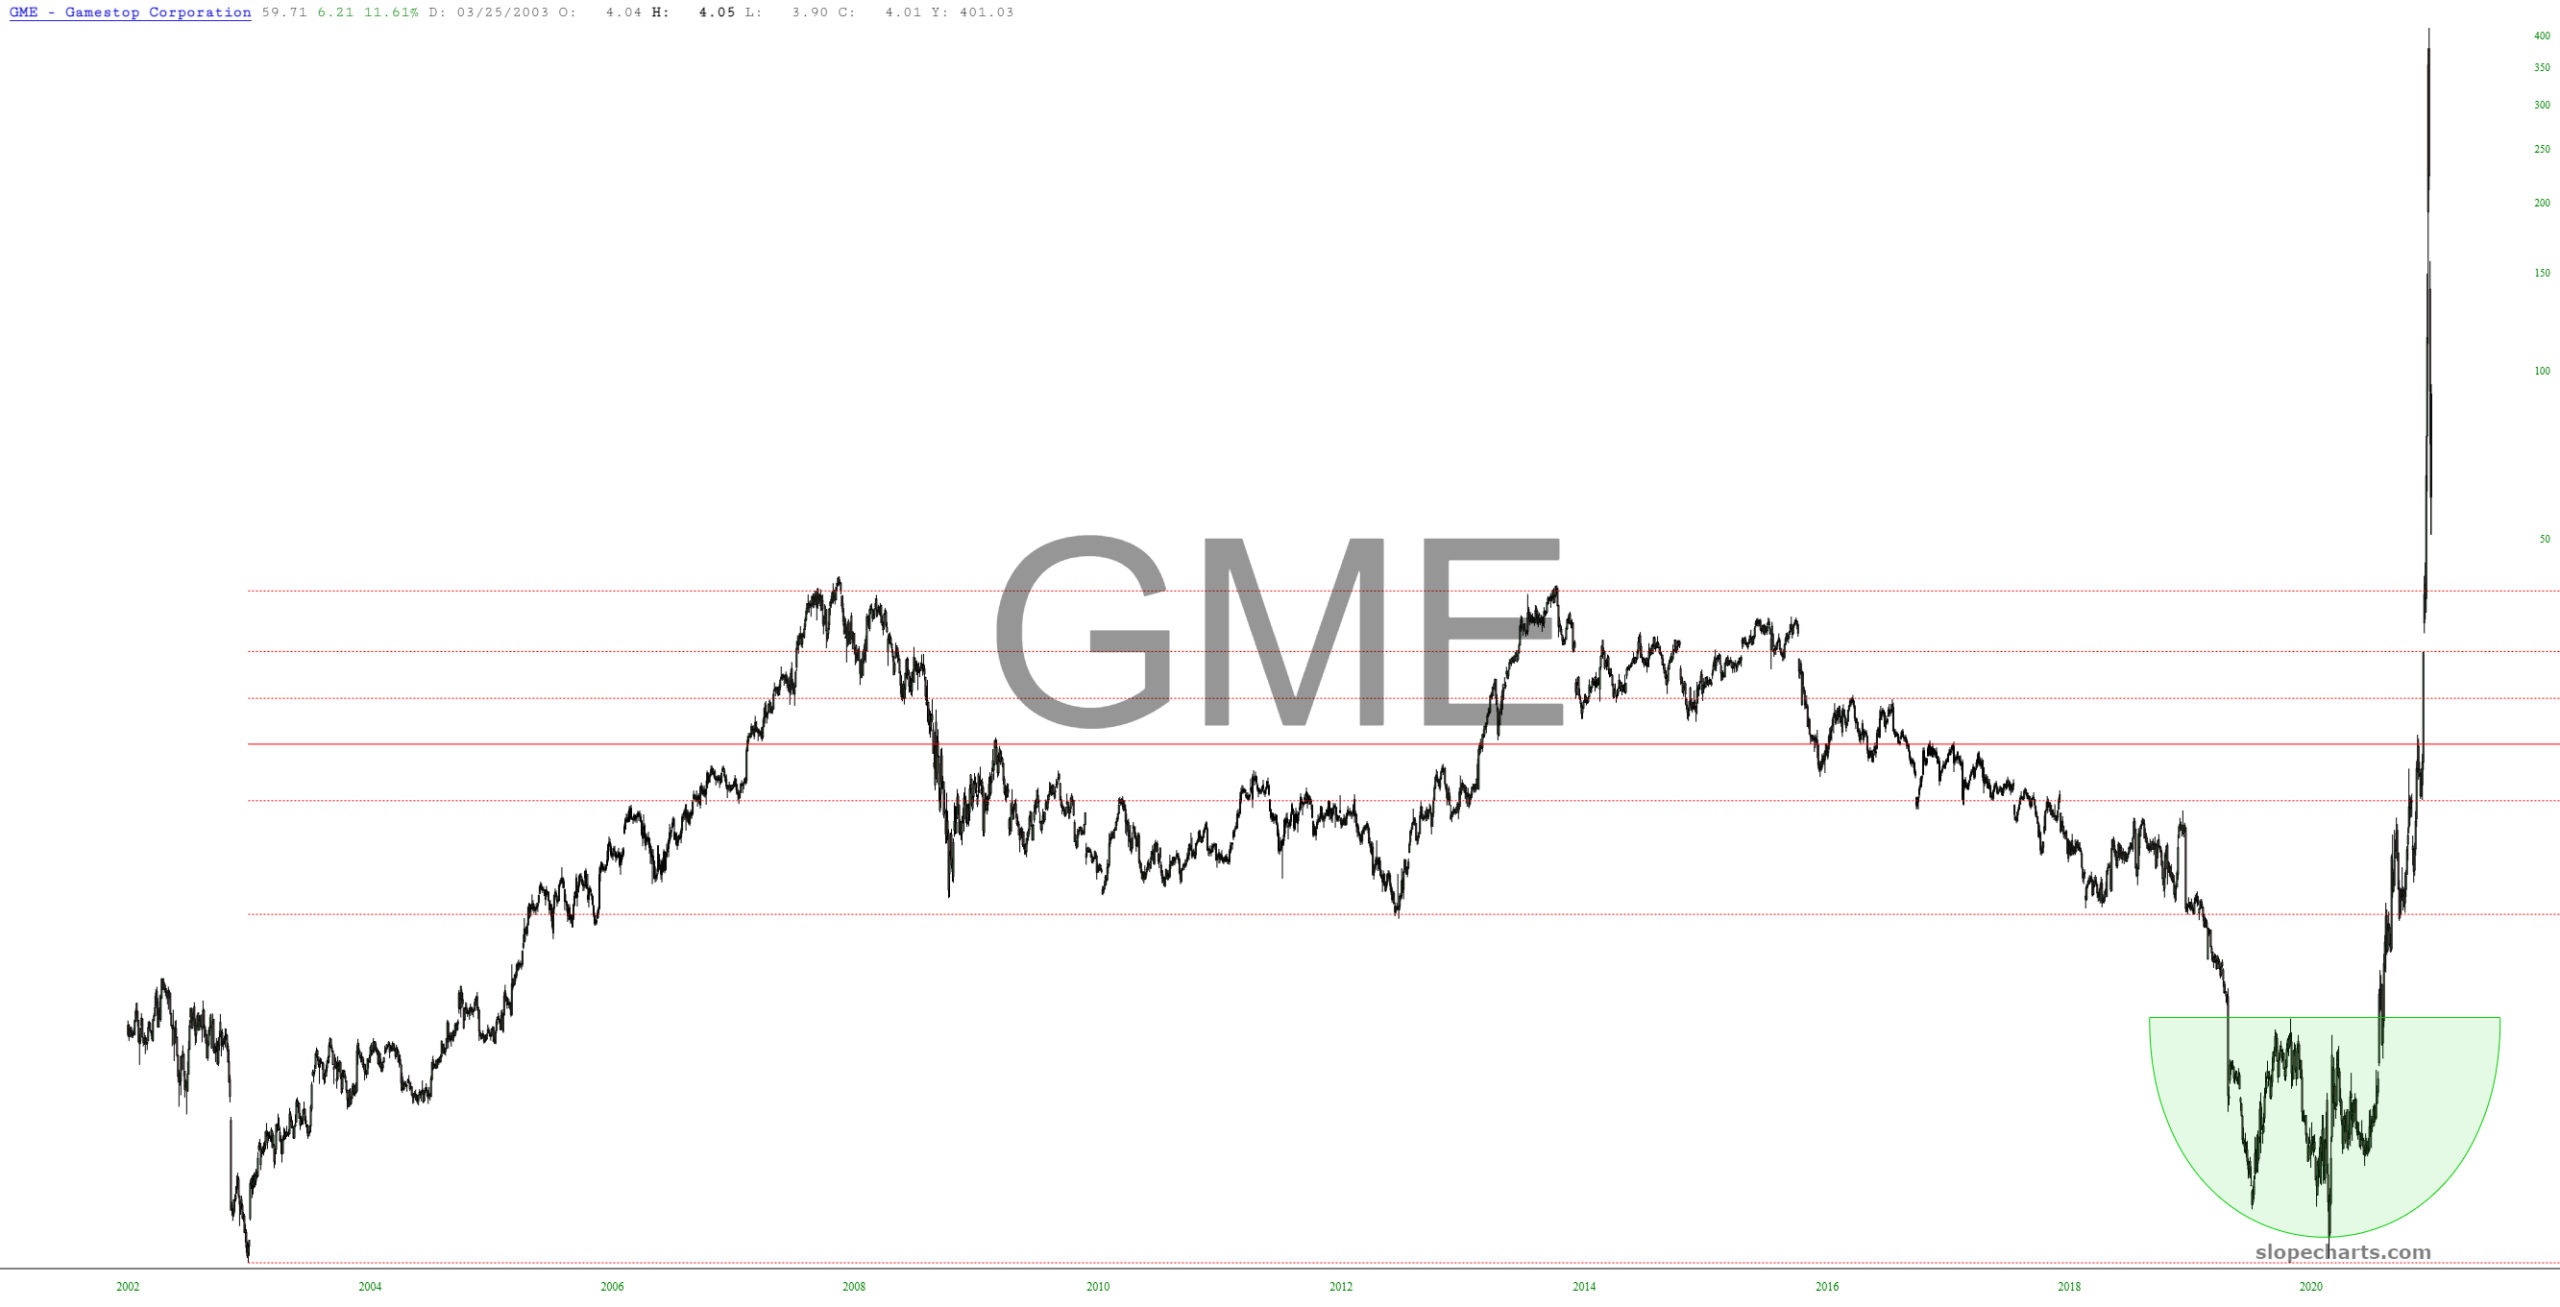
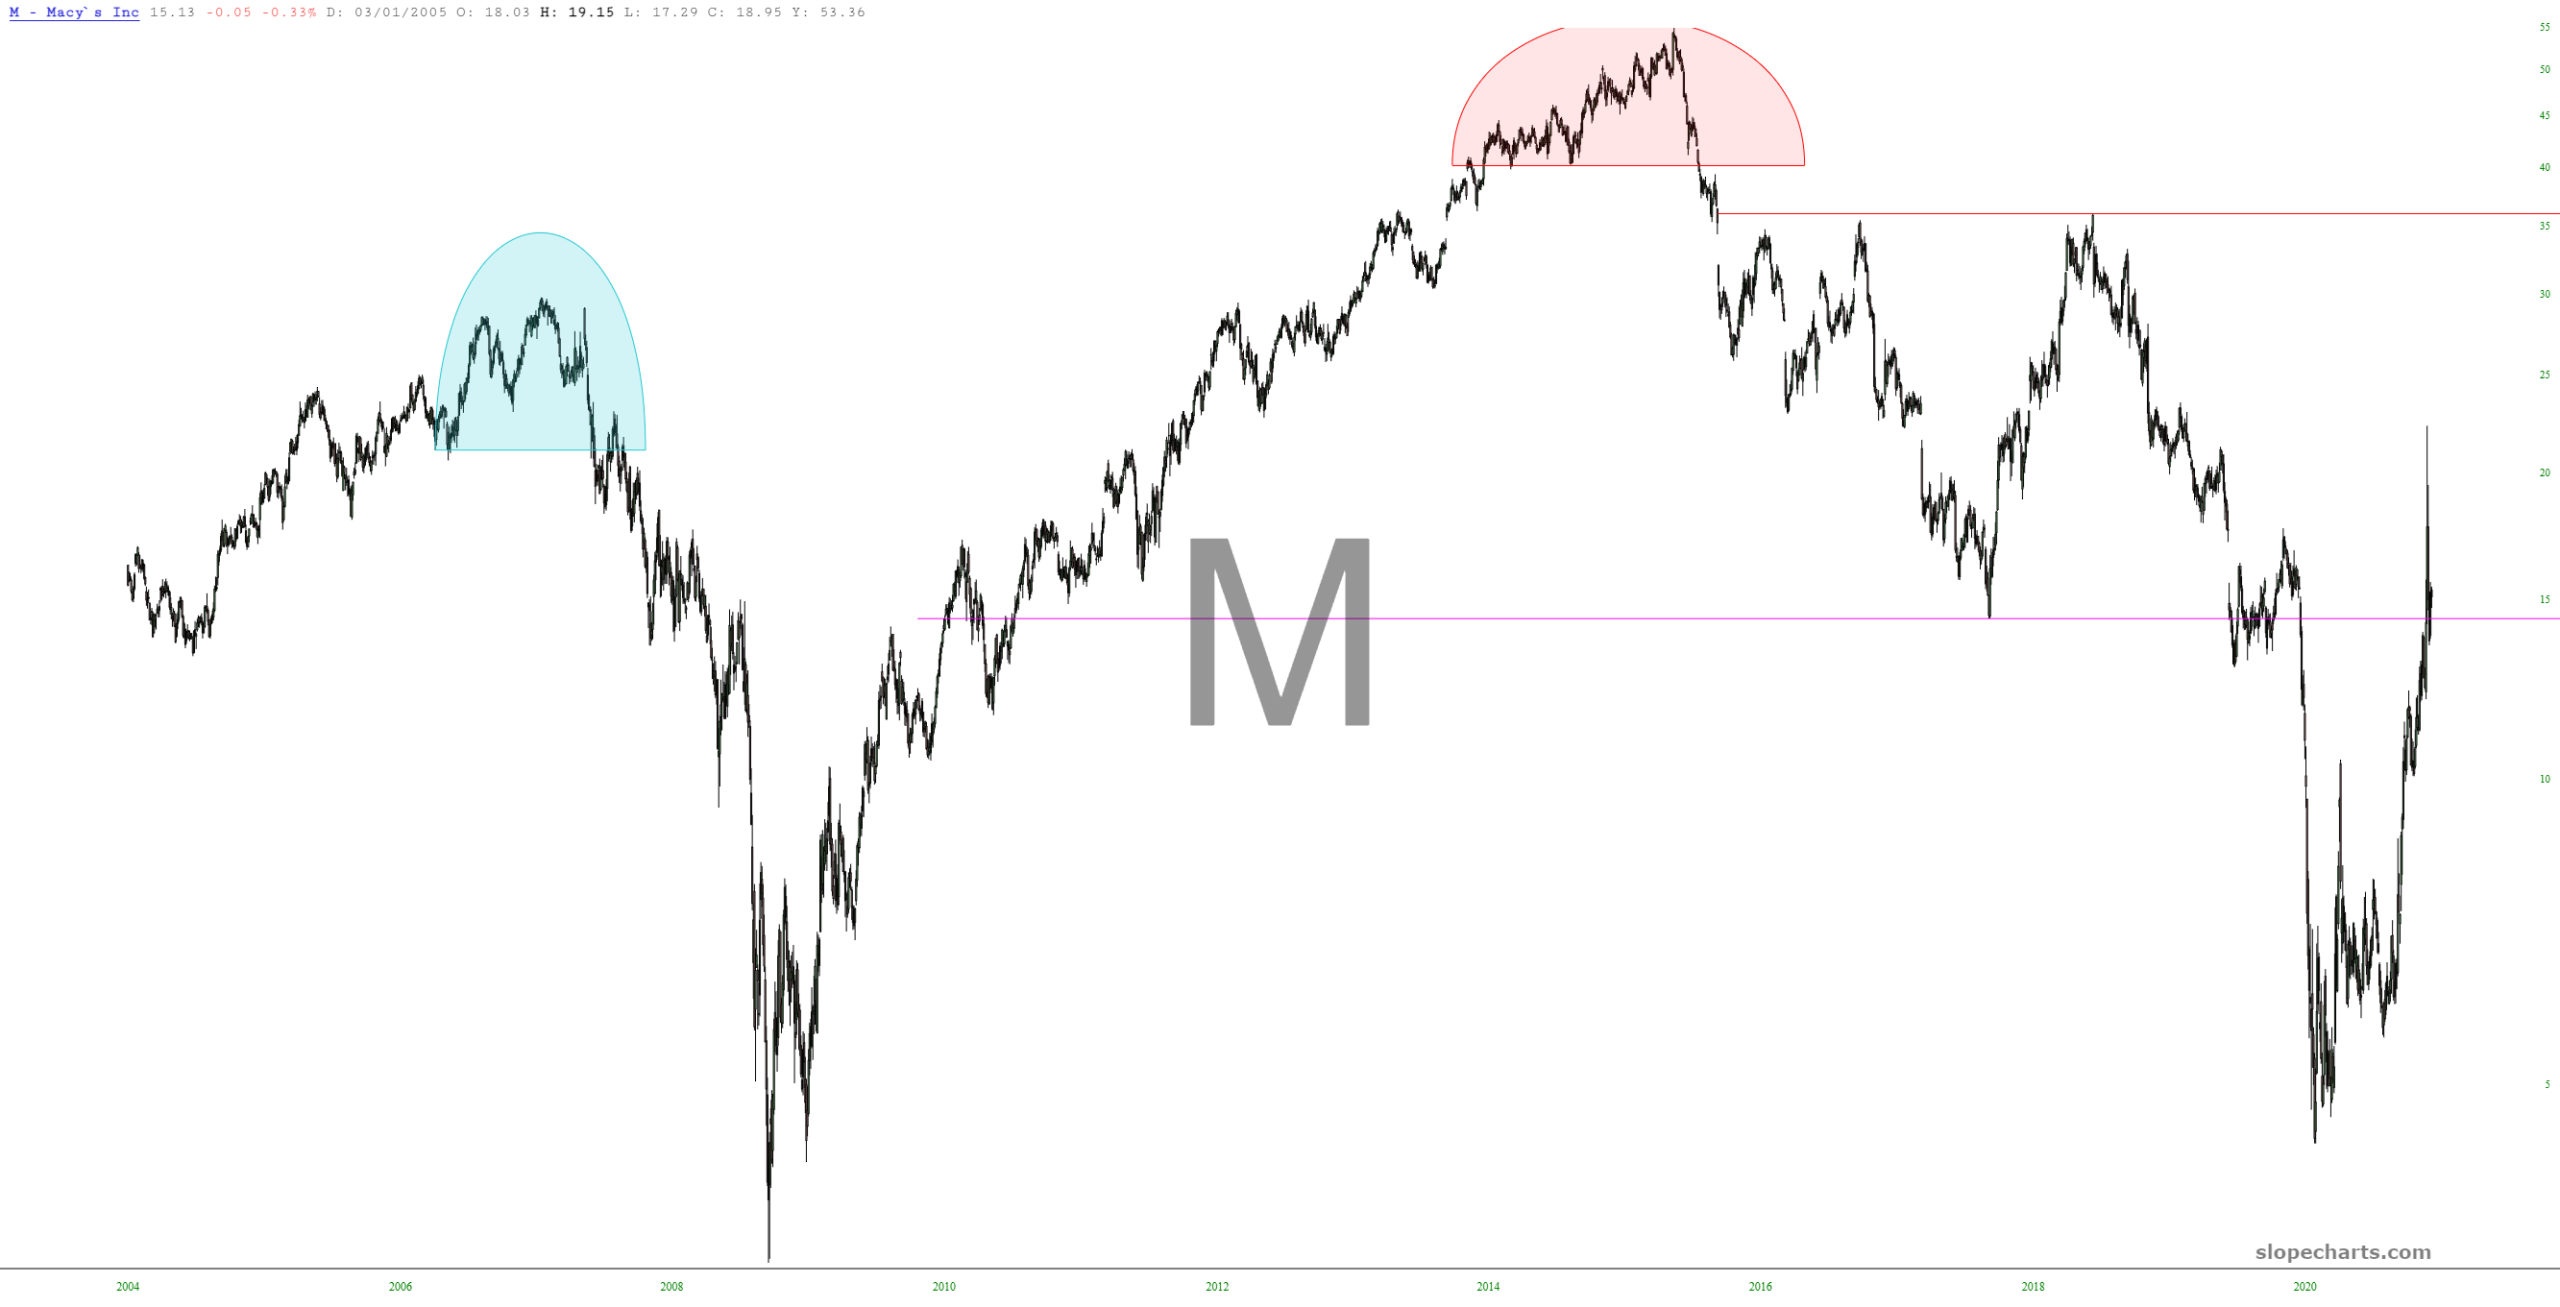
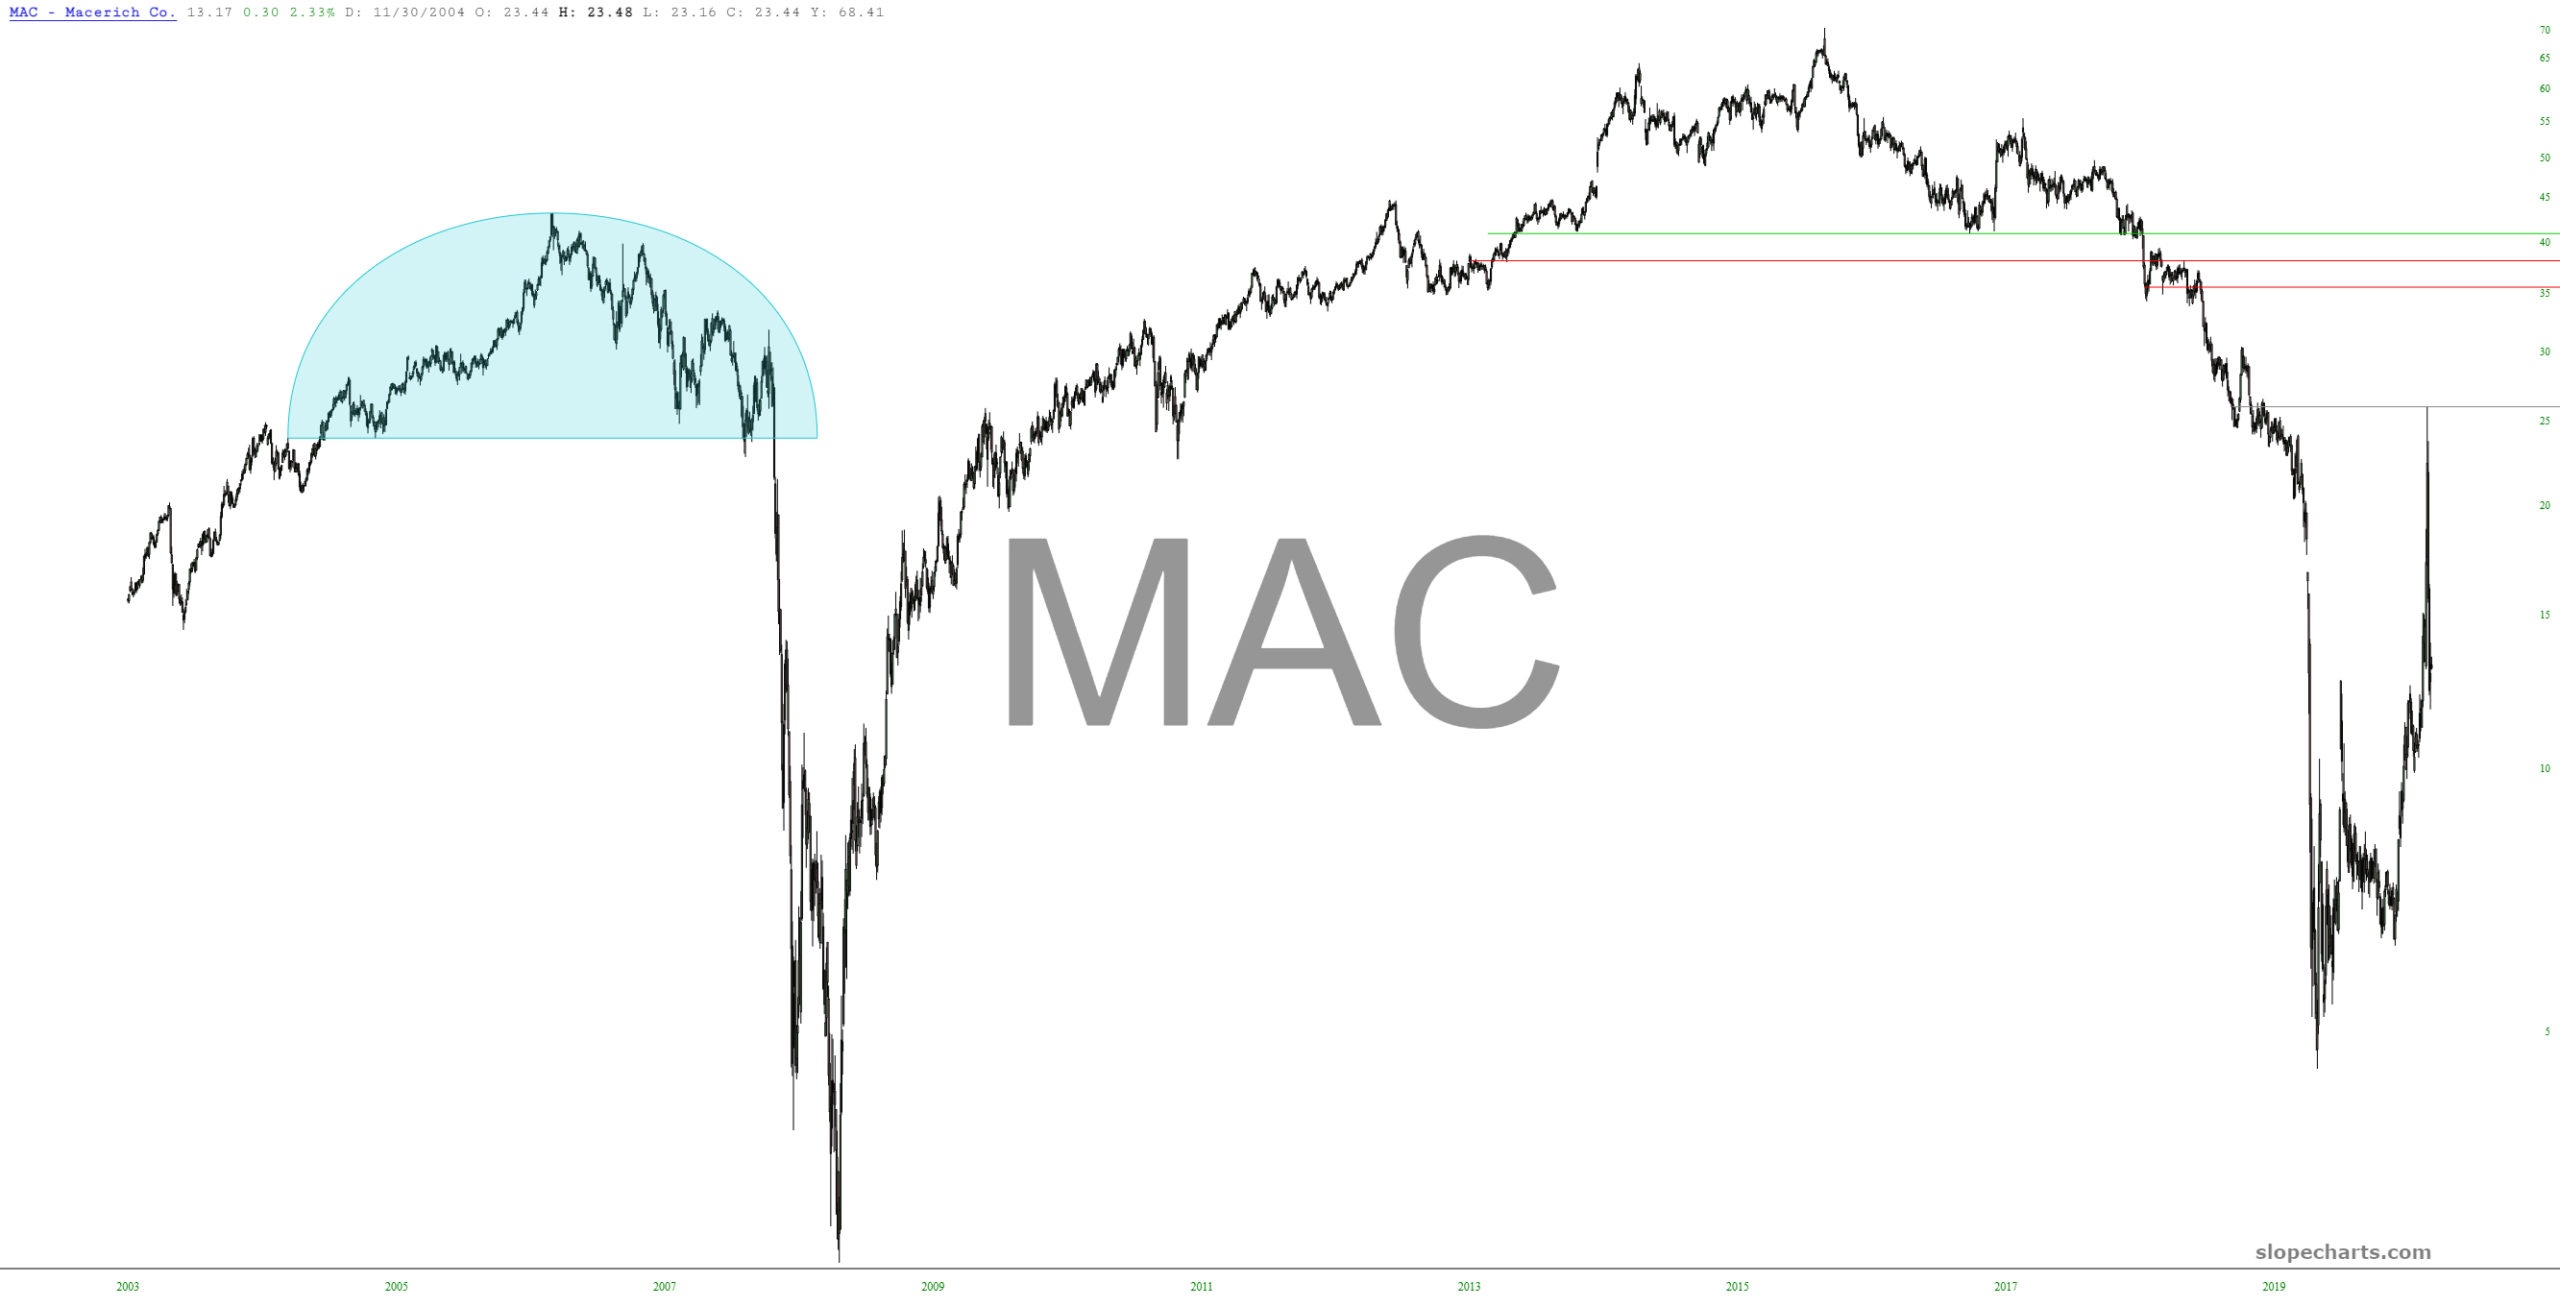
I didn’t want to show 74 charts, but I’ve plucked out ten that I think represent this nuttiness quite well. Take note that in every case a pattern-wrecking anomaly has taken place with price action.
![](https://slopeofhope.com/wp-content/uploads/2021/02/slopechart_BBBY-640x342.jpg)
![](https://slopeofhope.com/wp-content/uploads/2021/02/slopechart_CAKE-640x327.jpg)
![](https://slopeofhope.com/wp-content/uploads/2021/02/slopechart_CNK-640x327.jpg)
![](https://slopeofhope.com/wp-content/uploads/2021/02/slopechart_DDS-640x327.jpg)
![](https://slopeofhope.com/wp-content/uploads/2021/02/slopechart_AG-1-640x327.jpg)
![](https://slopeofhope.com/wp-content/uploads/2021/02/slopechart_GME-1-640x327.jpg)
![](https://slopeofhope.com/wp-content/uploads/2021/02/slopechart_M-640x327.jpg)
![](https://slopeofhope.com/wp-content/uploads/2021/02/slopechart_MAC-640x327.jpg)
![](https://slopeofhope.com/wp-content/uploads/2021/02/slopechart_PBI-640x327.jpg)
![](https://slopeofhope.com/wp-content/uploads/2021/02/slopechart_SKT-640x327.jpg)