
Ever want to truly understand the difference between a log chart and a standard arithmetic scale? Allow me to use an updated Dogecoin graph to bring this home.
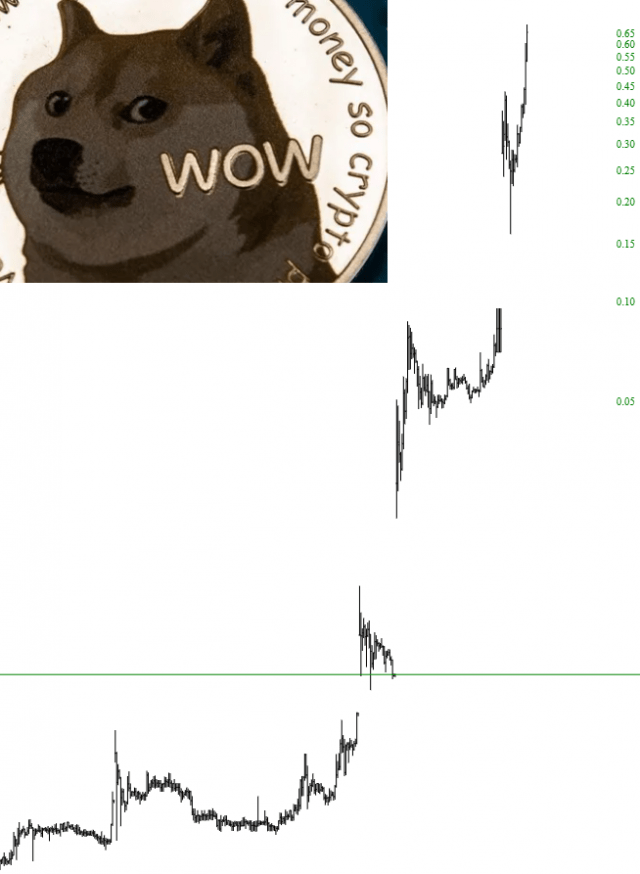
Here is a log scale chart:
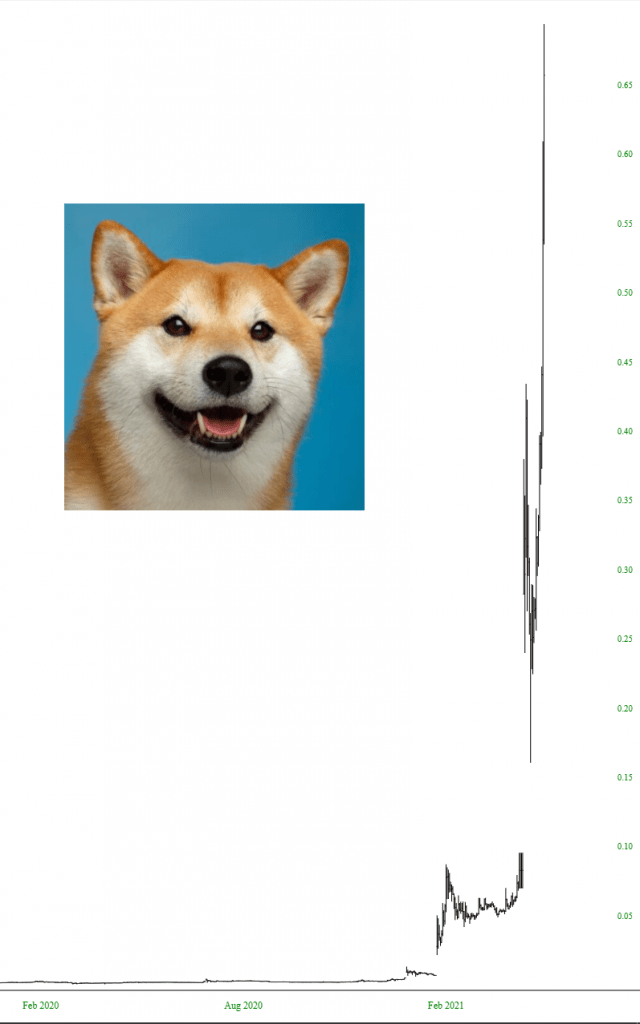
And here is the exact same data represented on an arithmetic scale. If you look closely, you can spot the difference.
They say the reason for all this is because Elon is hosting SNL. I can only think of Ashlee Simpson.
Anyone want to bet that $DOGE is going to fall during and/or after SNL does their close?
