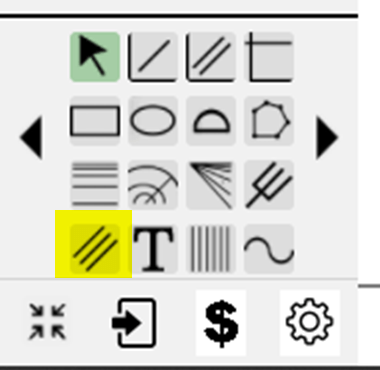
We’ve added a new drawing tool to SlopeCharts (two, actually): Linear Regression and the Raff Regression Channel. They are accessed via this icon:
To use it, you simply click on where the date you want to begin (the price level doesn’t matter, as the tool will figure out what is appropriate) and drag it to the ending date. A linear regression line will be drawn as you move the cursor.
You can change this to a Raff Regression via the Change Style dialog box or by just choosing it directly from the right-click menu. This creates a channel surrounding the linear regression line.