
The stock market, that’s what.
Now that yet ANOTHER trillion dollars in government waste (AKA the “infrastructure bill”) has been approved, the prospect of more tidal waves of cash sloshing around have pushed equities to yet more lifetime highs. Let’s stroll through some important ETF charts. As usual, click on any chart, and it will fill up your screen as best it is able.
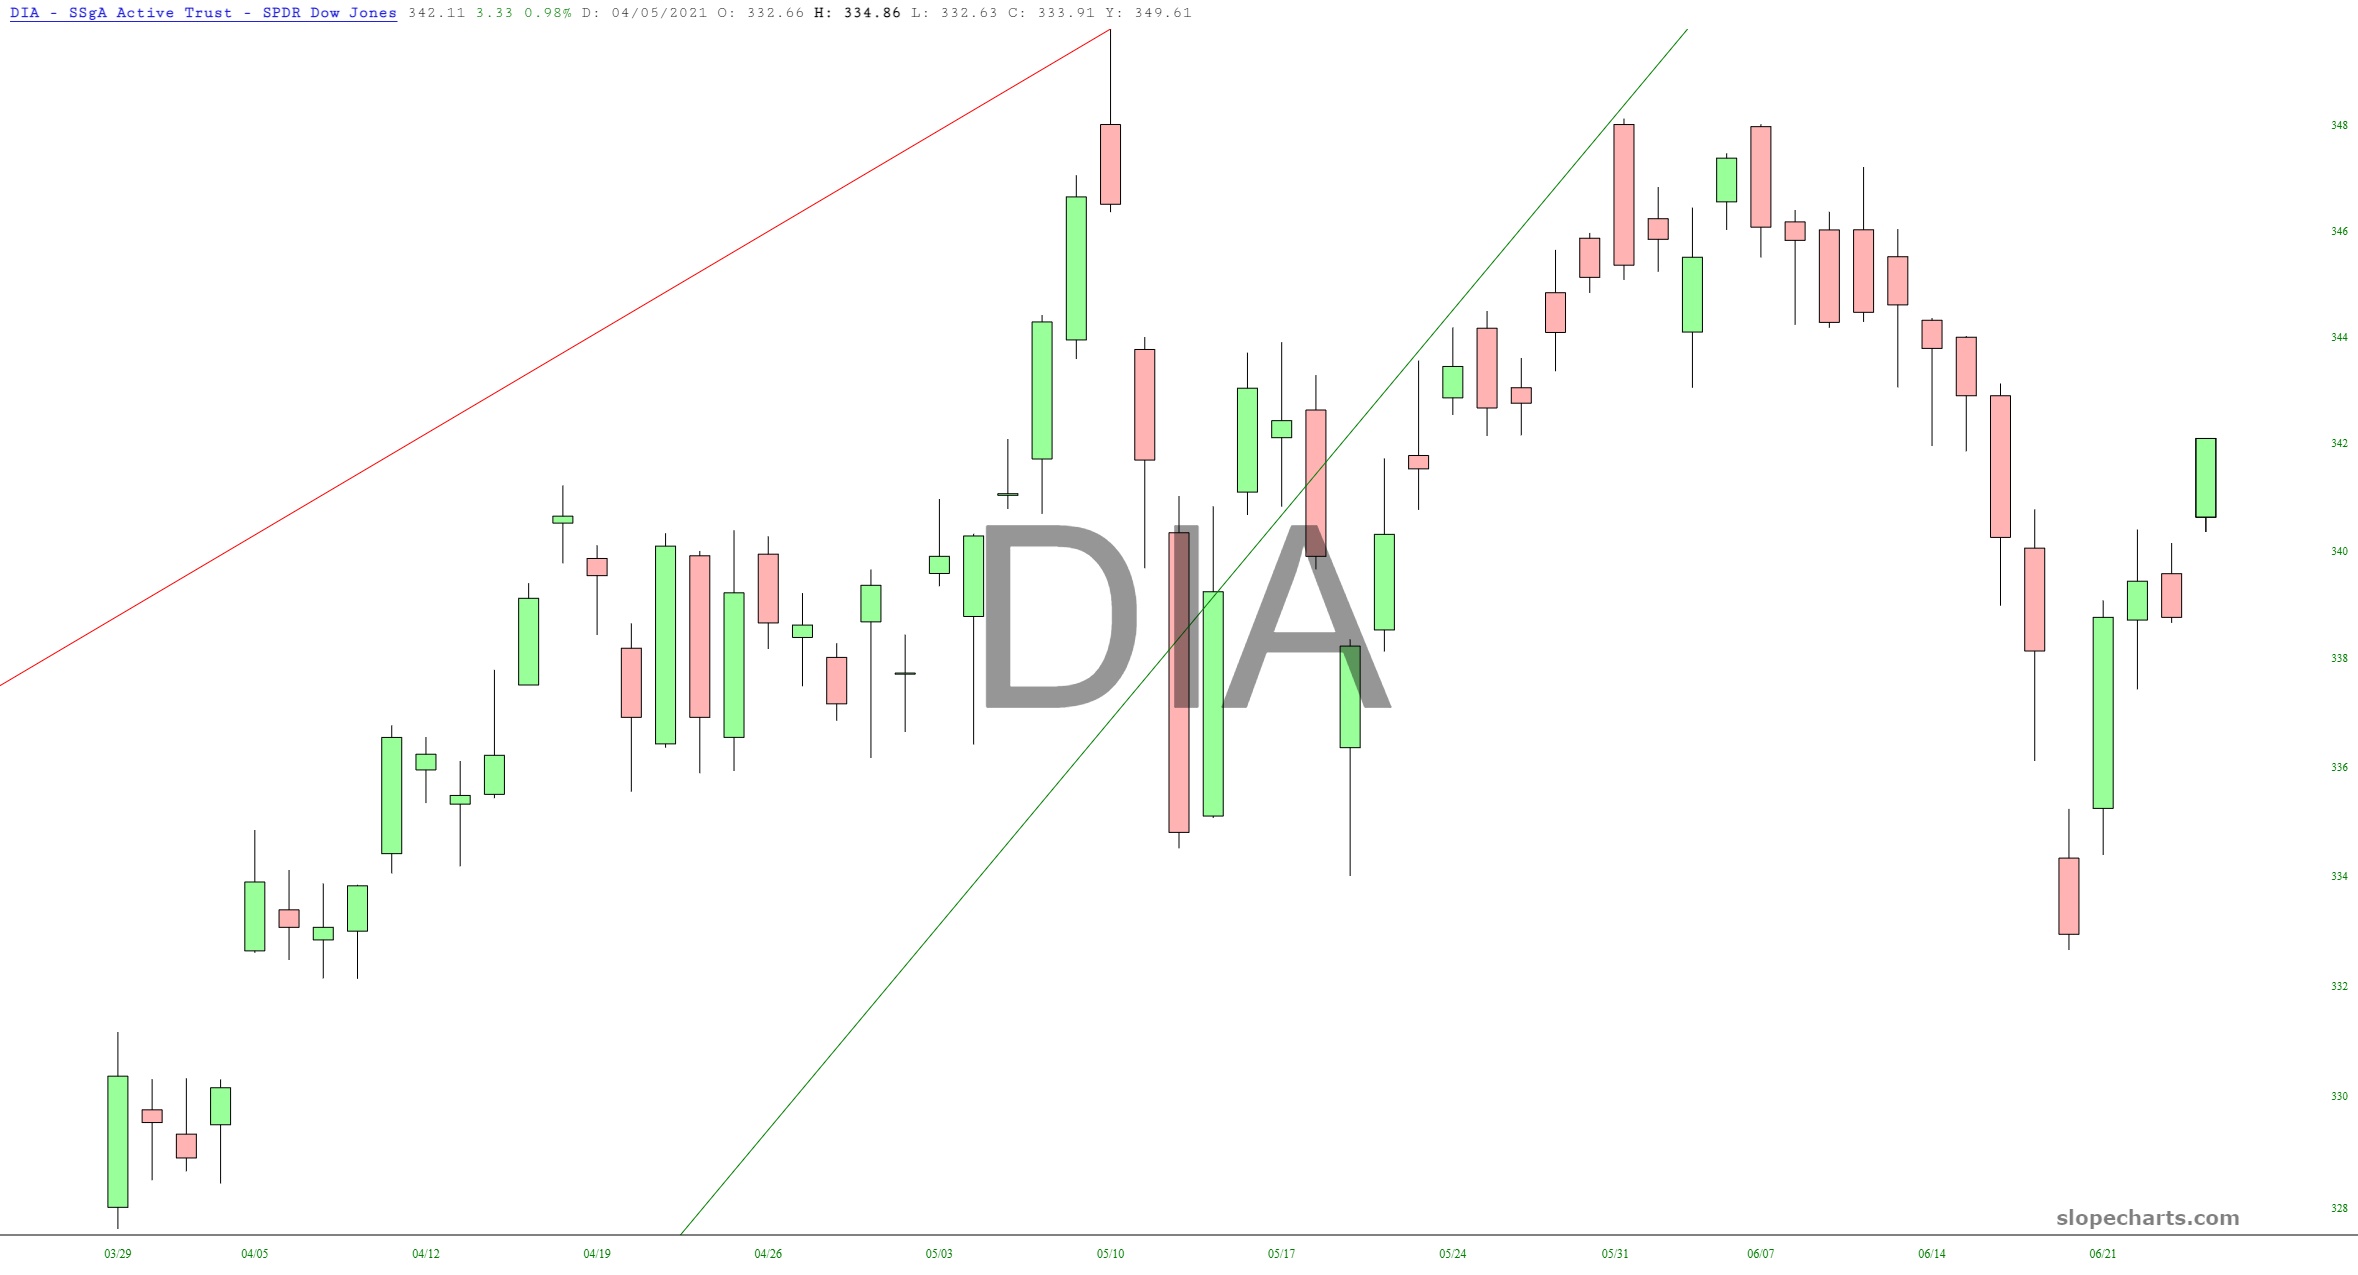
We begin with the diamonds, which had painted out ten red bars in a row, but have reversed hard and undone about half the damage.
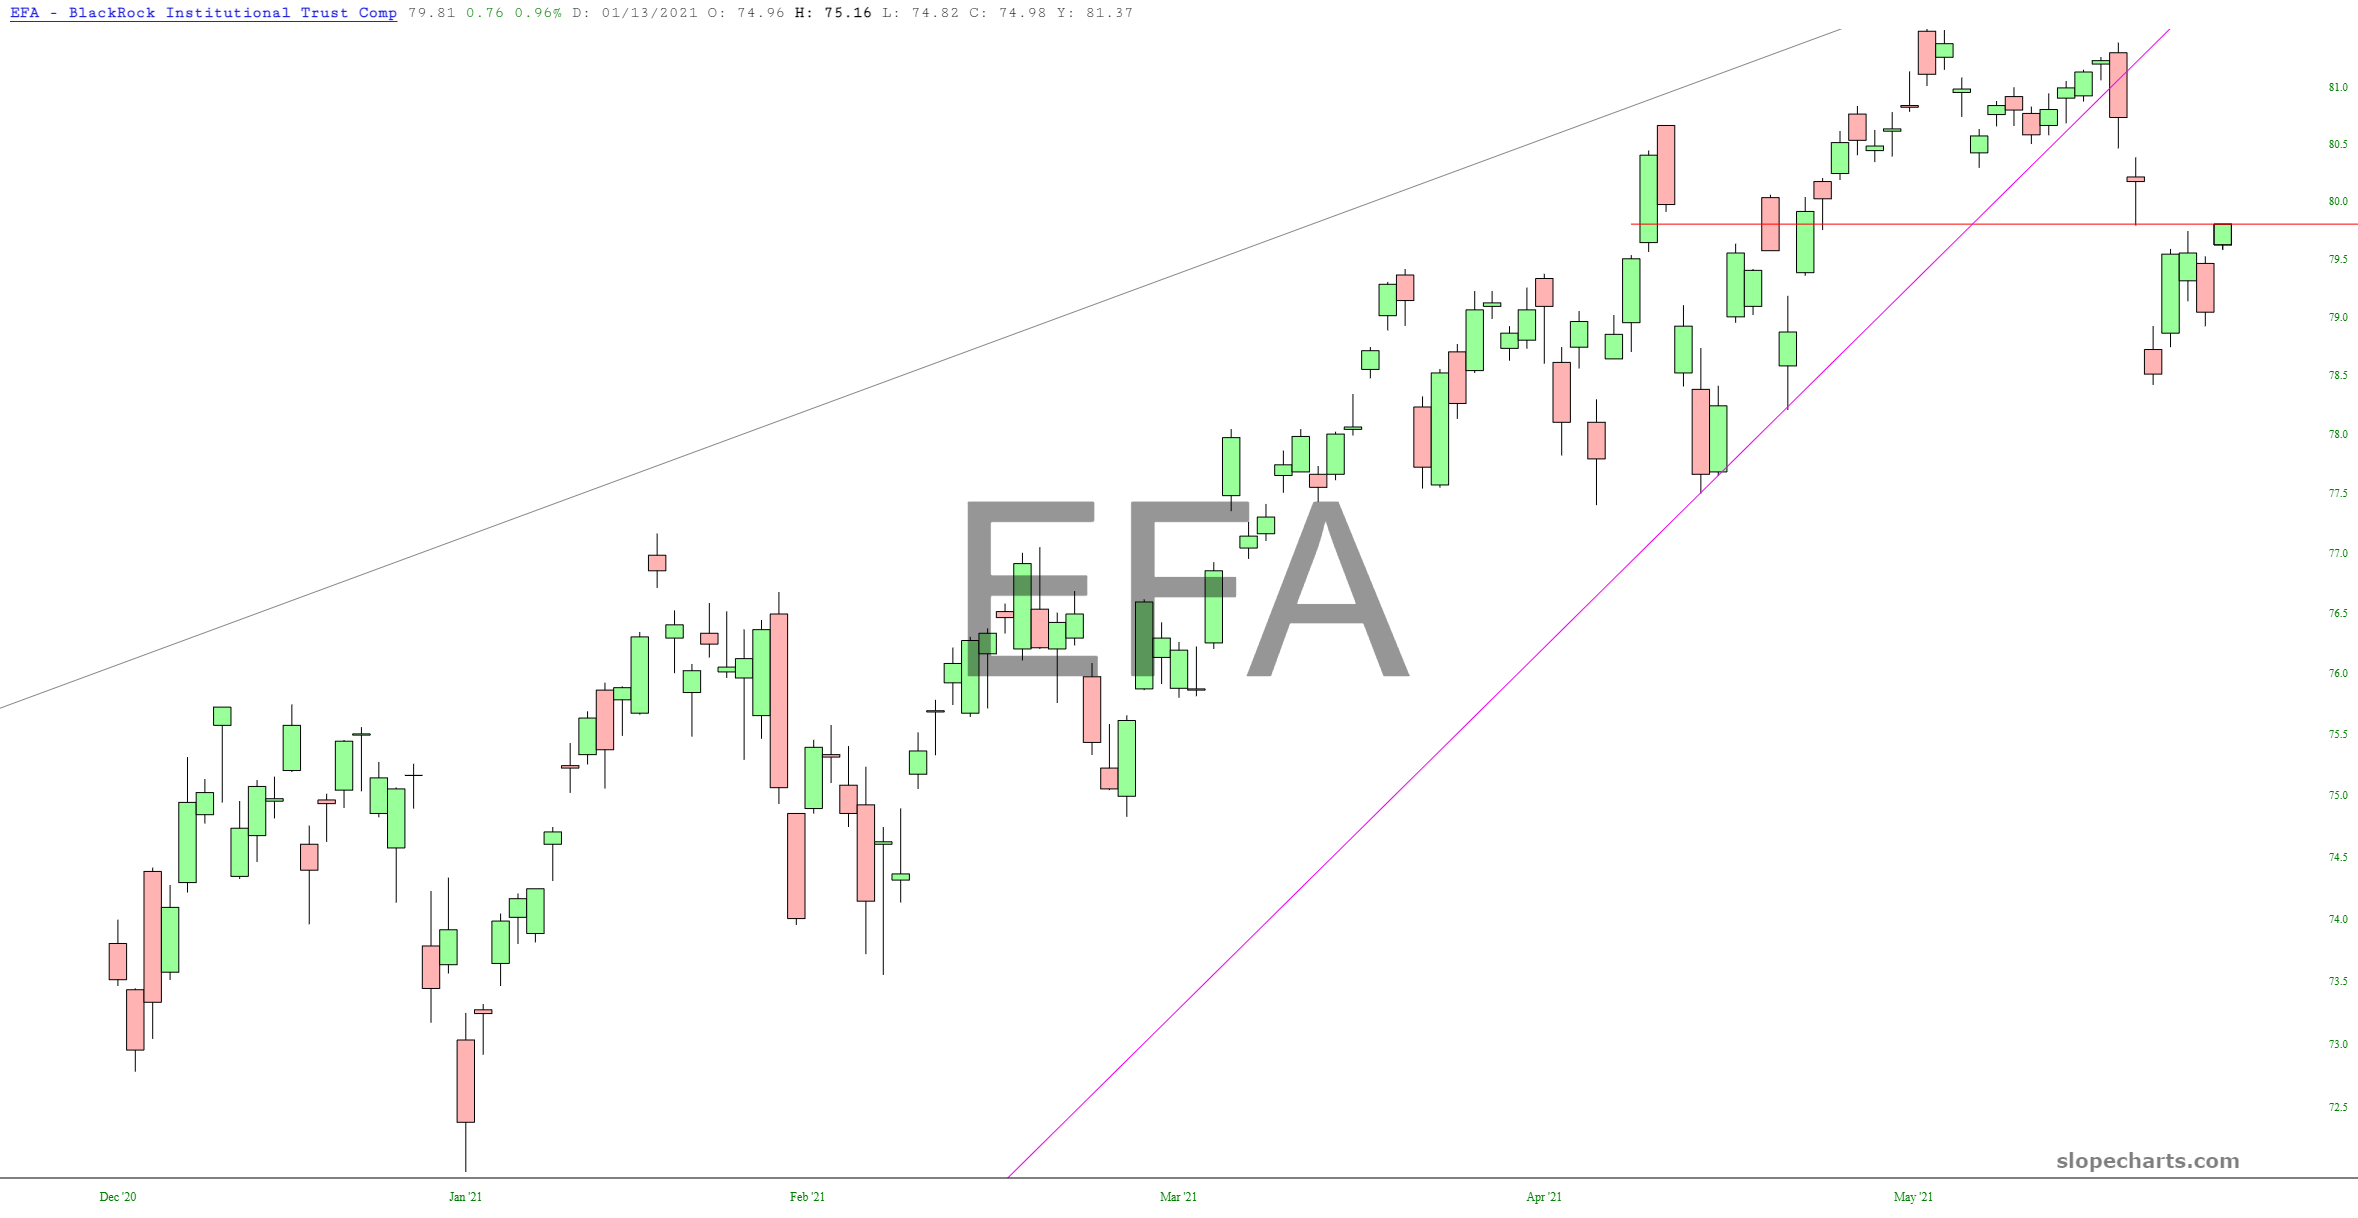
However, we are indeed seeing wedge breaks all over the place. The diamonds was one. The MSCI (Europe) based ETF, symbol EFA, is another. Take note of the failure of the wedge and the fact its subsequent strength has merely pushed it back to the resistance line.
The so-called precious metals are still struggling. It’s kind of painfully funny, in a gallows humor kind of way, that in this “asset crack-up boom”, just about the only asset that seems to be ignoring the party is the precious metals sector.

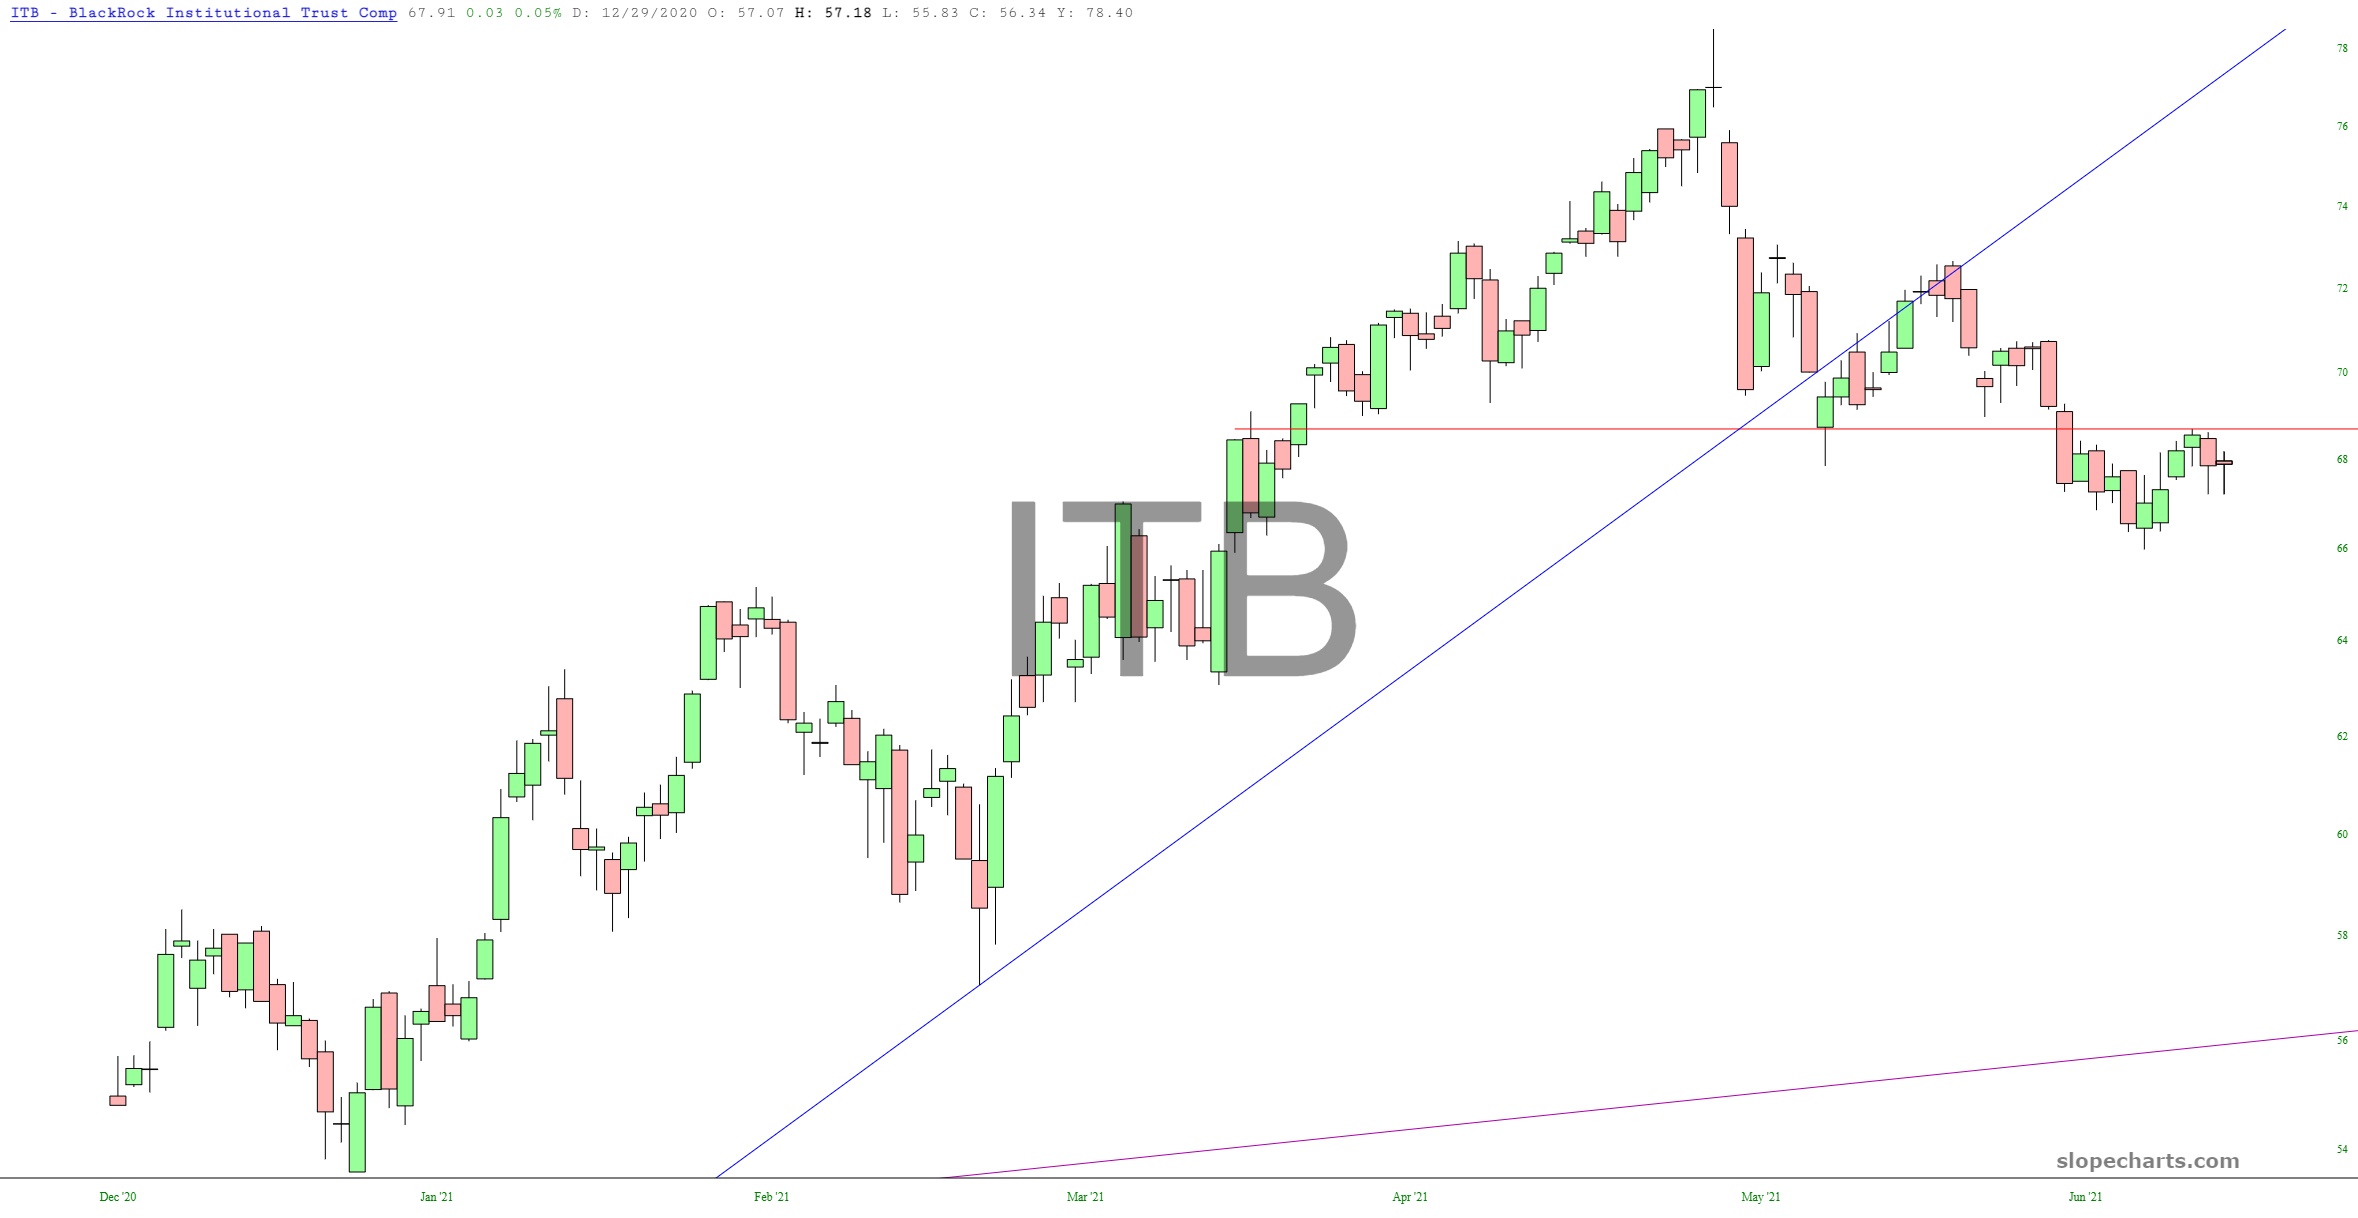
Homebuilders continue to stay weak, with the small head and shoulders pattern staying neatly intact and prices remaining below the completed neckline.
Here are seven more ETF charts, viewable by all paying members:
