
I would like to offer a possibility which I certainly hope is not the case, but I shall put it forward anyway. Here is my so-called MICE chart (which I dubbed, perhaps as a misnomer, Most Important Chart Ever) which is the S&P divided by the prevailing interest rate. I have adjusted the channel to incorporate all the moves in recent years.
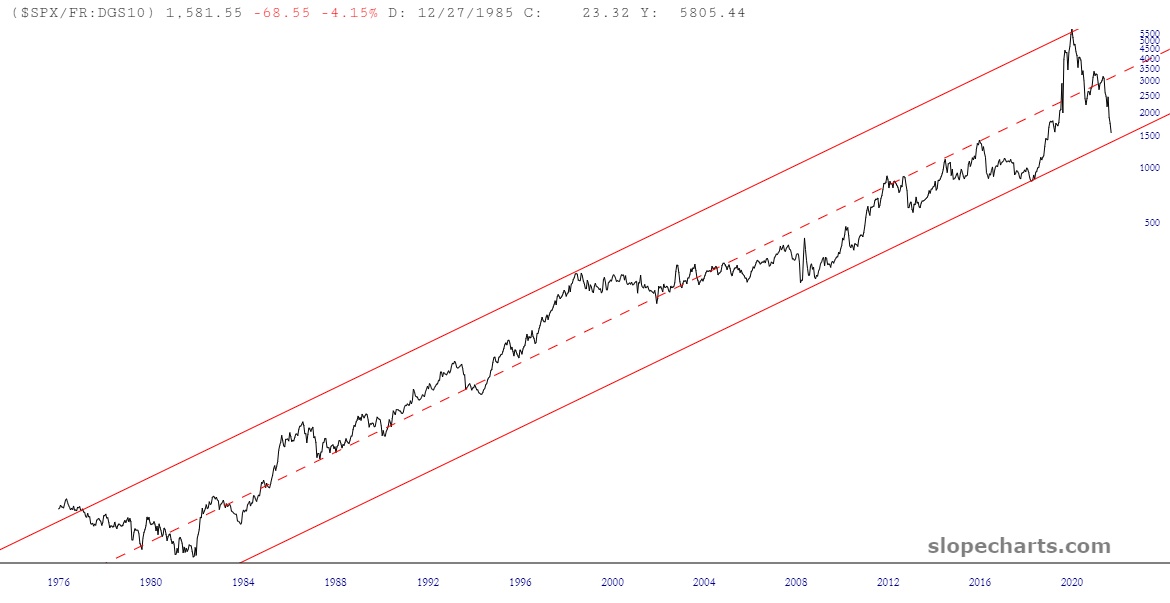
My concern here is this – – as the chart is appropriate its lower trendline, is this seriously all we’re gonna get? I mean, as I am typing this, the S&P is down all of 8% from its lifetime high? Seriously? Seriously? So we go from insanely overvalued to merely astronomically?
The biggest element of this plunge in the chart is interest rates, of course, not equity prices. My only point is to consider the importance of this long-term channel and wonder out loud how much more juice we can squeeze out of this lemon.
