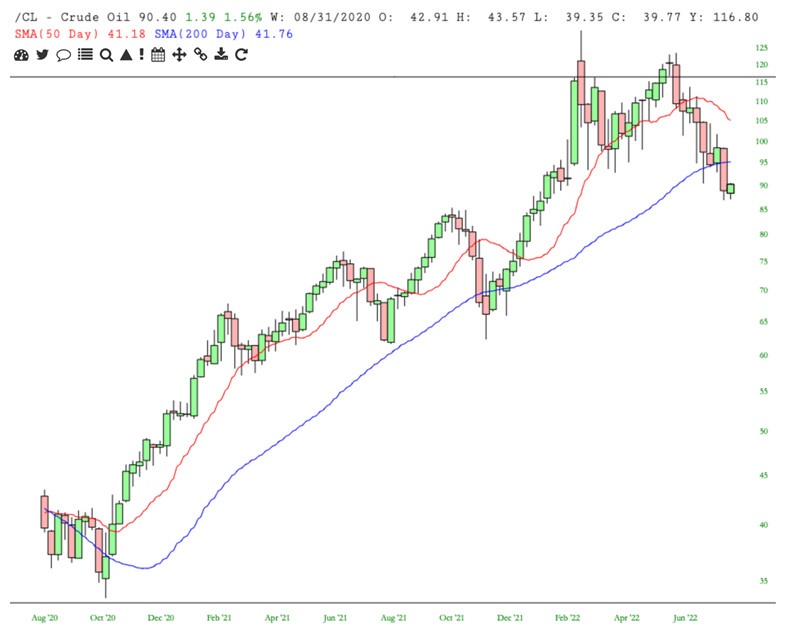
The chart looks quite bearish for sure.
It is worth noting that the crude oil price only stabilized and began falling in earnest with massive Strategic Petroleum Reserve releases.
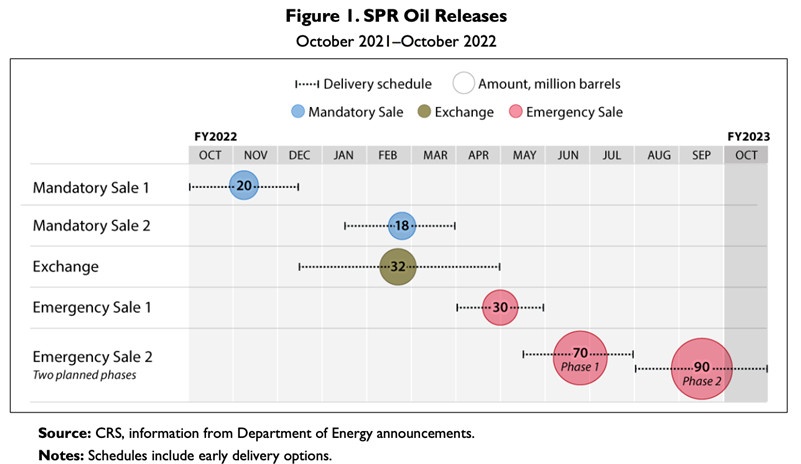
Making some rough assumptions from the SPR graph below, beginning April 1 releases of 730,000 bbls/day began (a combination of an ongoing releases that began mid-December 2021and the “Emergency Sale 1” that began April 1, 2022).
The estimated daily amount increased to about 935,000 bbl/day on June 1, 2022 and is now running at about 1,000,000 bbls/day under “Emergency Sale 2” which is set to end on October 31, 2022.
For context, the most prolific oil producing basin in the US in the Permian Basin which produces approximately 5,000,000 bbls/day.
It will also be curious to see if or when the US government decides to replace the 260 million barrels that have been drawn down since October 1, 2021.
For context, the most prolific oil producing basin in the US in the Permian Basin which produces approximately 5,000,000 bbl/day.
Perhaps the chart is saying demand destruction is taking place and increased production from Russia, Saudi Arabia, Libya, Iraq, Iran, etc. is happening.
Or maybe it’s the large SPR releases that have finally balanced the market and now slightly oversupplied it and is doing the work to chase out recent hot money bullish entrants.
I wonder where those 1,000,000 bbls/day will come from to balance the market beginning November 1, 2022.