
I am very pleased to be announcing the introduction of a new tool here on Slope known as SOAP, which stands for Slope Options Analyzer for Payoffs. That’s a mouthful, so we’ll just refer to it as the Payoff Analyzer.
You can access the Payoff Analyzer by clicking here or choosing it from the Options menu:
The purpose of the tool is to create a “payoff” chart so that, for a given options spread trade, you can assess its maximum loss, maximum profit, and break-even point. With this initial version, it only does vertical spreads, but its functionality and flexibility will expand as time goes on.
The input area offers you a variety of fields to define the options spread you would like to examine:
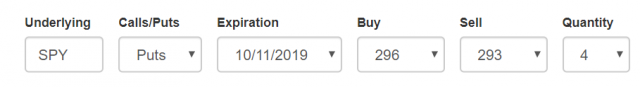
- The underlying symbol; the default is SPY, but you can enter any optionable symbol you want;
- Choice between Calls or Puts;
- Choice of expiration (it will automatically load the legitimate expirations for the symbol you have entered);
- Dropdown for the “Buy” side of the trade;
- Dropdown for the “Sell” side of the trade
- Optional choice for the Quantity of options. The default is 1, but if want the math adjusted to take into account a larger quantity of options, you can choose it here.
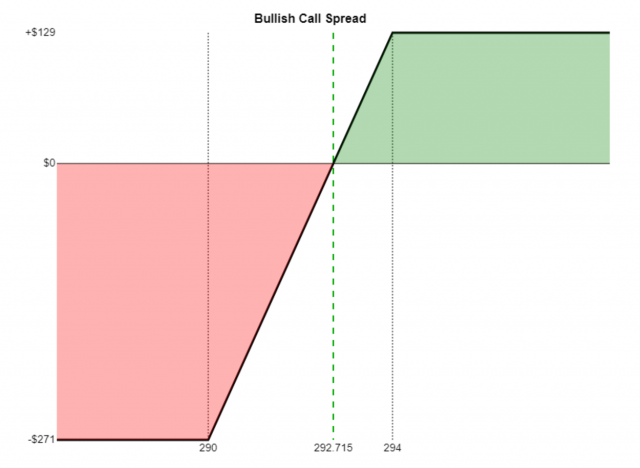
The dropdowns are automatically populated with strike prices that are close to the present price of the underlying, but you can change either or both of the strike prices for the legs. When you do, the graph will be presented along with the name of the strategy you have defined. Presently we have the Bullish Call Spread:
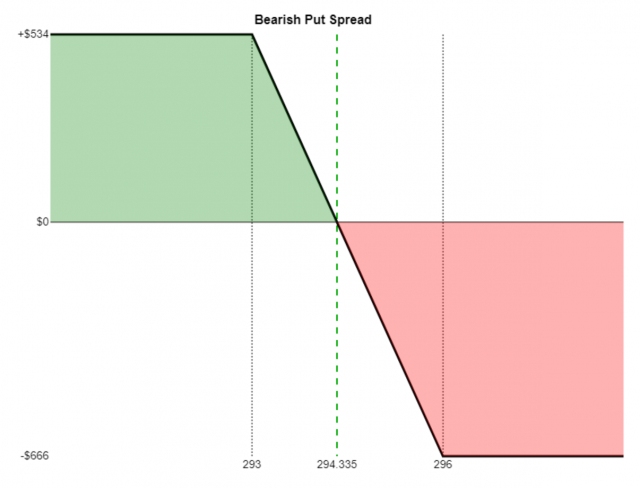
The Bearish Put Spread:
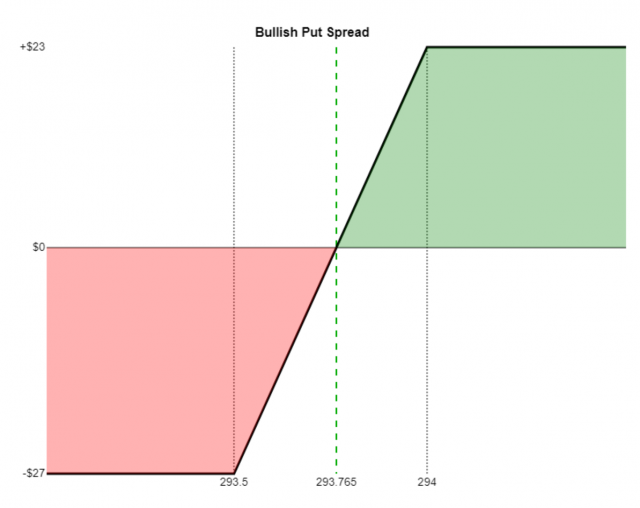
The Bullish Put Spread:
And, lastly, the Bearish Call Spread:
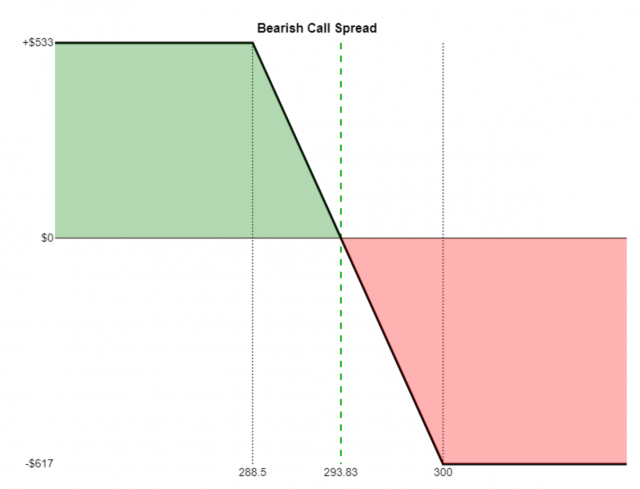
Each graph provides useful information:
- A visual representation of the profit zone (green) and loss zone (red);
- Two vertical lines, representing the strike prices for each leg;
- A dashed line showing the break-even value for the underlying on expiration day;
- In the upper left, the value of the maximum possible profit (not including commissions);
- In the lower left, the value of the maximum possible loss. Both the profit and loss will take into account the quantity you have chosen.
To be clear, this graph does not take into account time premium, time delay, or any of the other “Greek” calculations. It is a deliberately simplistic way of viewing opportunity strictly through the lens of the ultimate payoff (or loss, as the case may be) by the time the option legs reach their expiration point.
