
SPX traded above the daily upper bollinger band all day on Friday and closed eight points above it. A move like this often runs to three days trading above the upper band and if that’s the case today then I would expect the upper band to close in the 1742-5 area, and for SPX to close no more than ten points above the upper band. What is also worth noting on this daily chart though is that SPX tested rising wedge resistance from the June low on Friday, and regardless of whether this breaks later, we may well see a retracement from this test here. SPX daily chart:
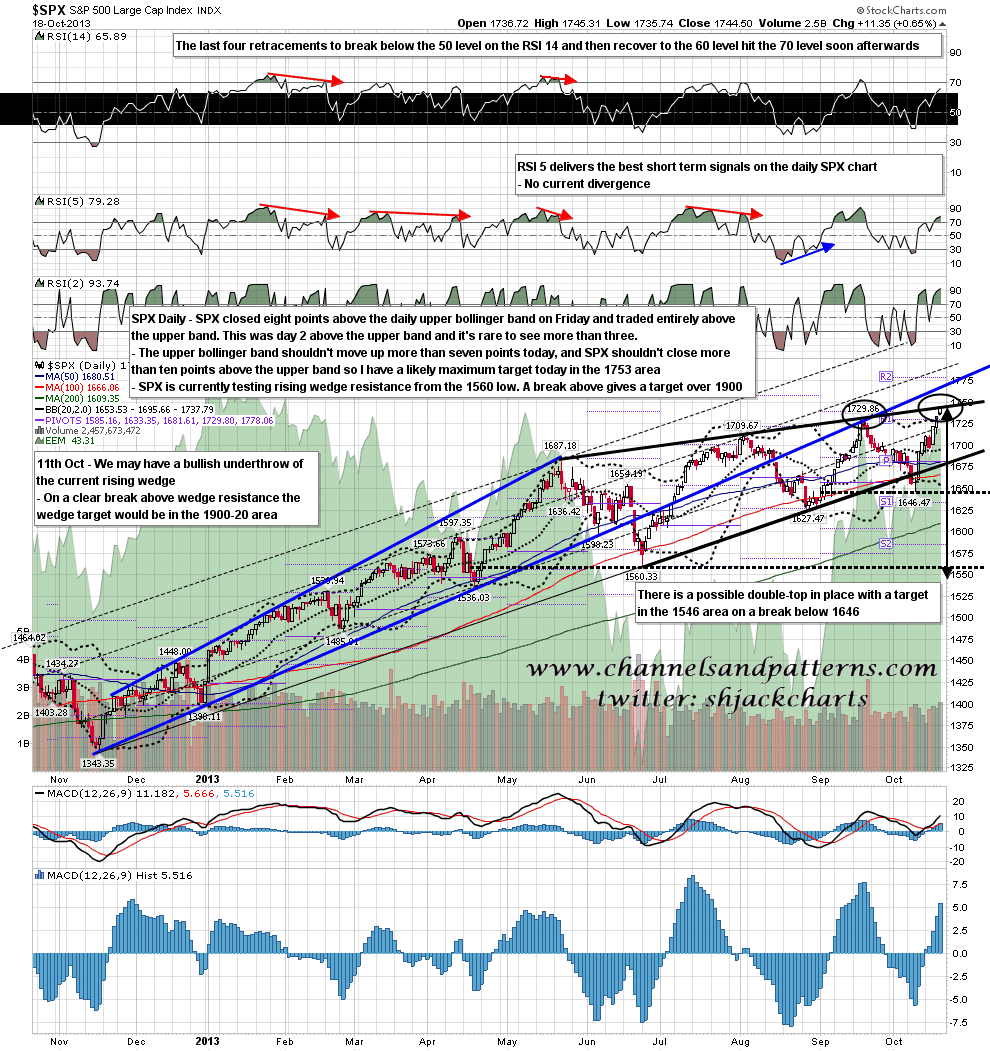
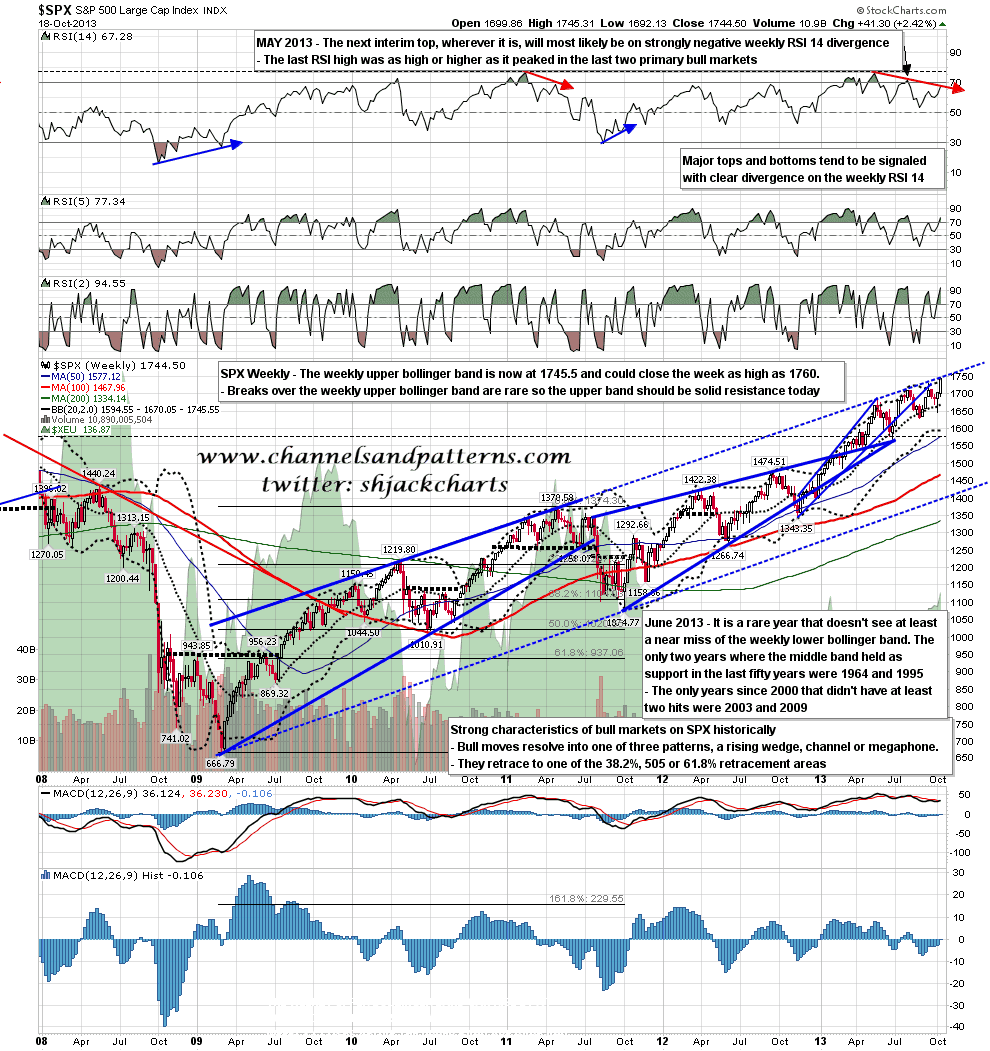
That rising wedge trendline is not the only SPX resistance here. There is also a resistance trendline from the 2010 high through the 2011 high that is clearly resistance here. That we are testing this for the second time in 2013 is suggesting that this trendline may well break up, but again a touch of it here may well be good for a retracement. That is particularly the case because SPX closed at the weekly upper bollinger band on Friday. It is rare to see SPX break above this on a weekly basis, and such a close above generally signals a significant high, so to continue rising SPX will now be limited to the 10-15 points a week that the weekly upper band can rise. That suggests a two way market with frequent retracements if this uptrend continues into the end of the year. SPX weekly chart:
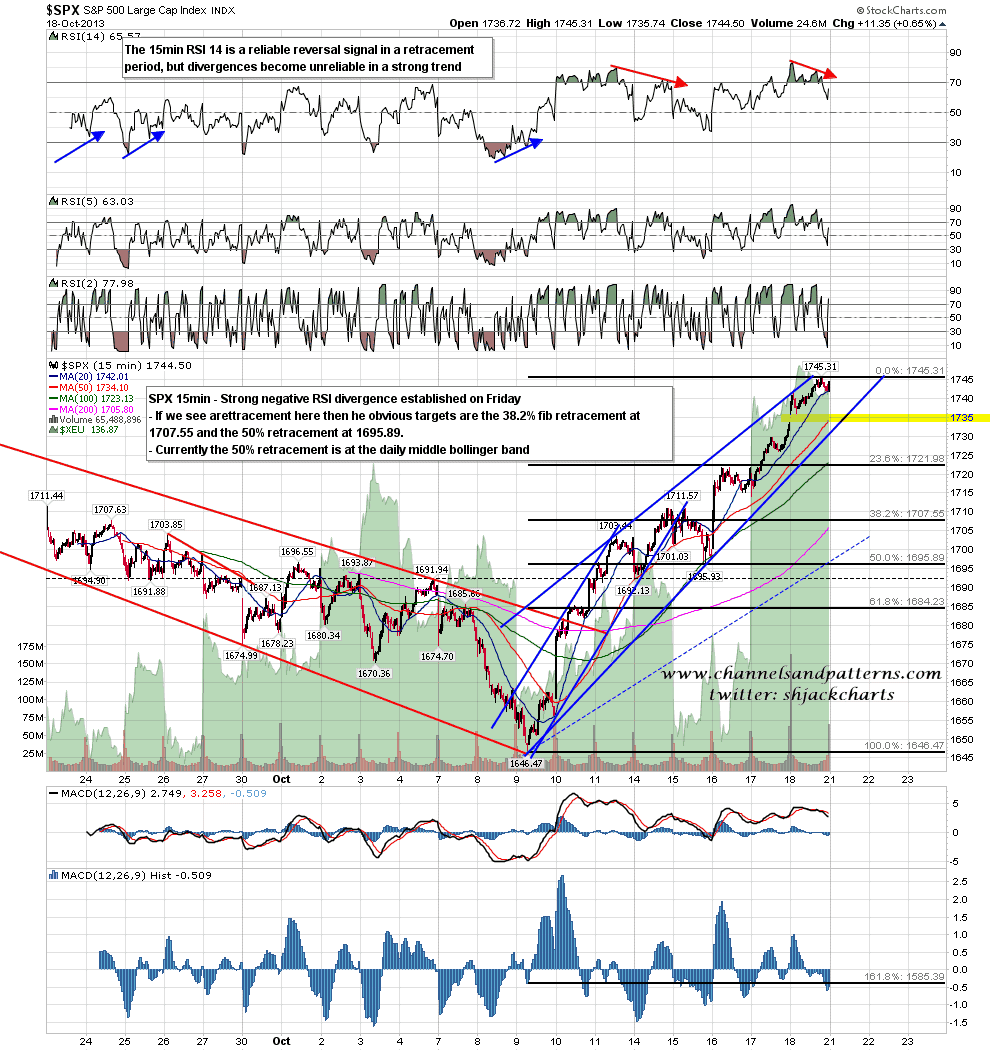
There is some reason to think that retracement is imminent. There is clear negative RSI divergence on the ES 60min chart, and also on the SPX 15min chart below. If we do see a retracement here I have initial support in the 1732-6 area. On a break below 1730 I would be looking for support in the 1708 and 1696 areas. SPX 15min chart:
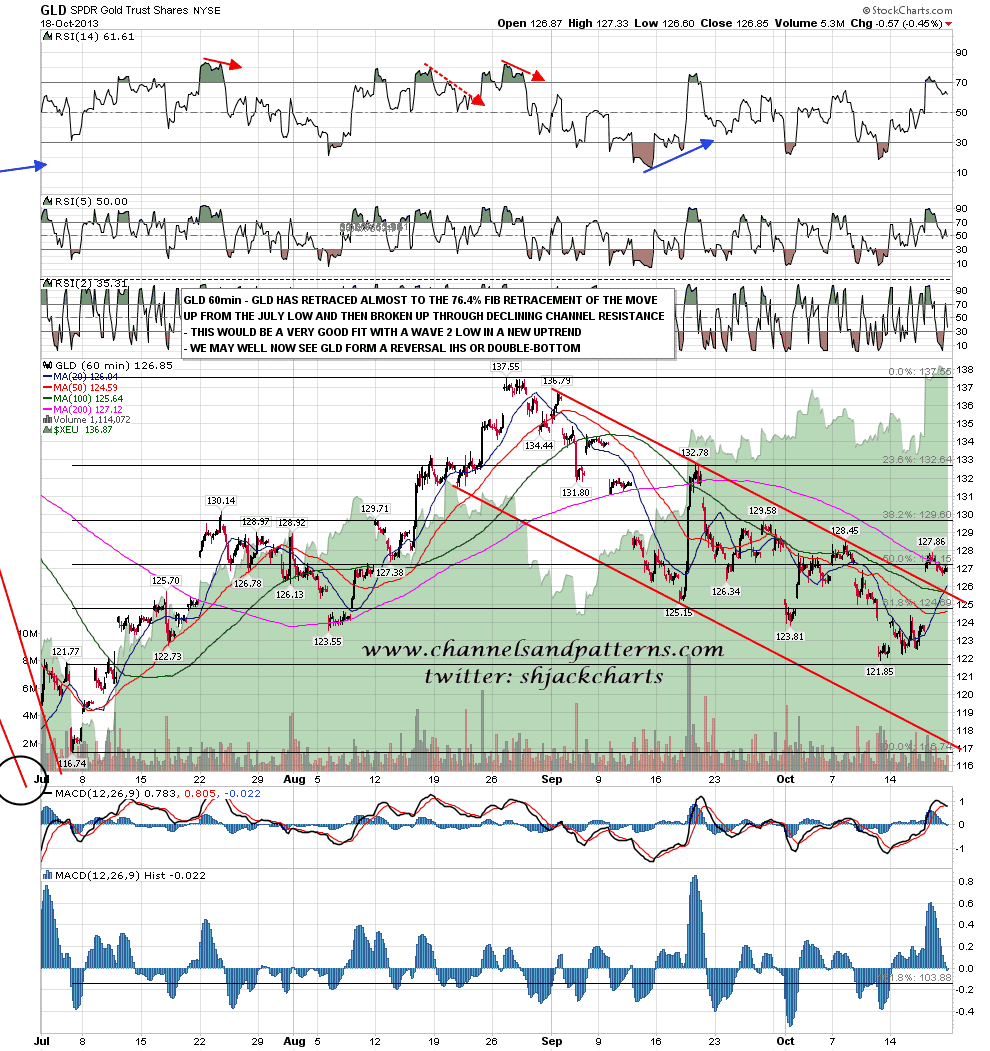
On other markets CL is now under 100 and is nowhere near oversold on the daily RSIs. My working target there is the 91.5 to 92 area. Gold is looking interesting, and you can see on the GLD 60min chart below that GLD gapped over falling channel resistance after retracing just under 76.4% of the move from the up from the July low. This is a development suggesting that the July low may well have been the bear market low for precious metals, and I’m watching for GLD to form and break up from a clear double-bottom or IHS. GLD 60min chart:
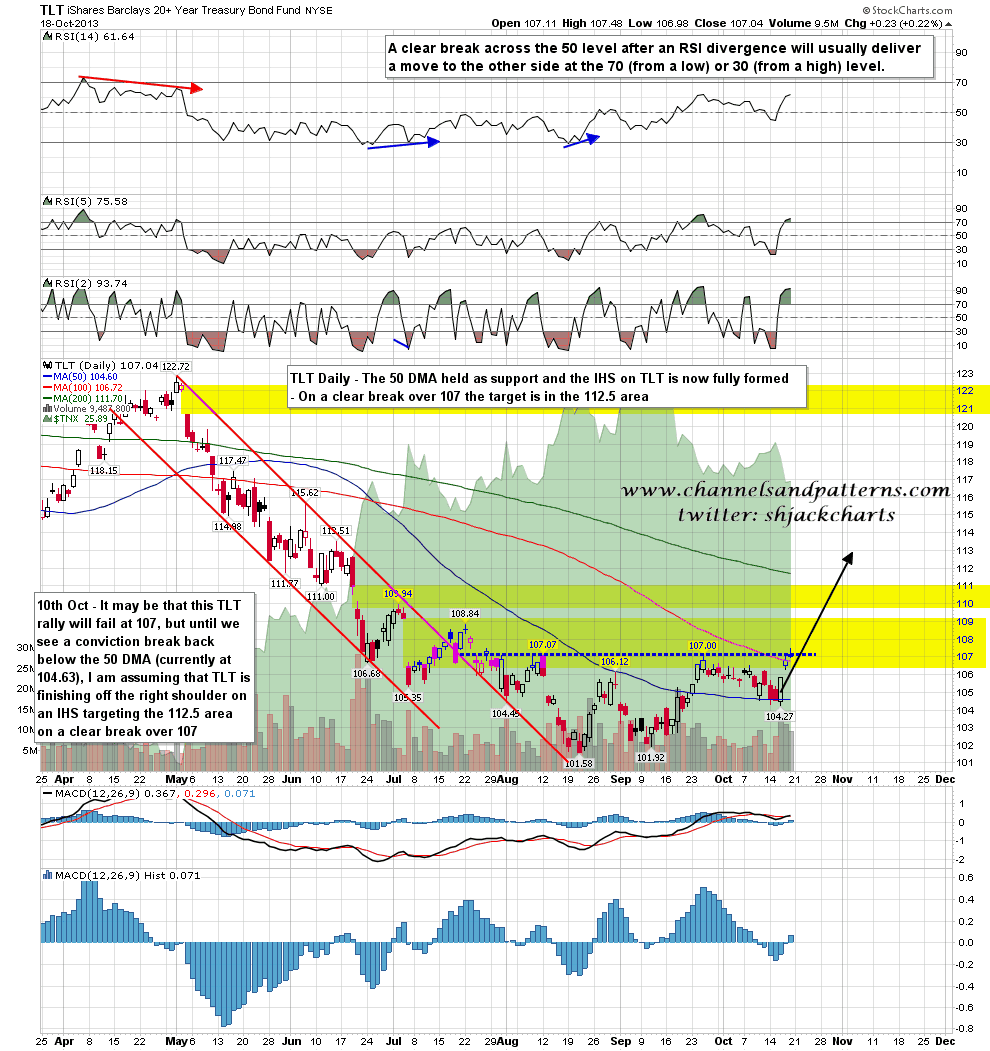
On TLT the possible IHS I have been following for a couple of weeks now has finished forming and is testing the neckline. A clear break over 107 targets 112.50. TLT daily chart:
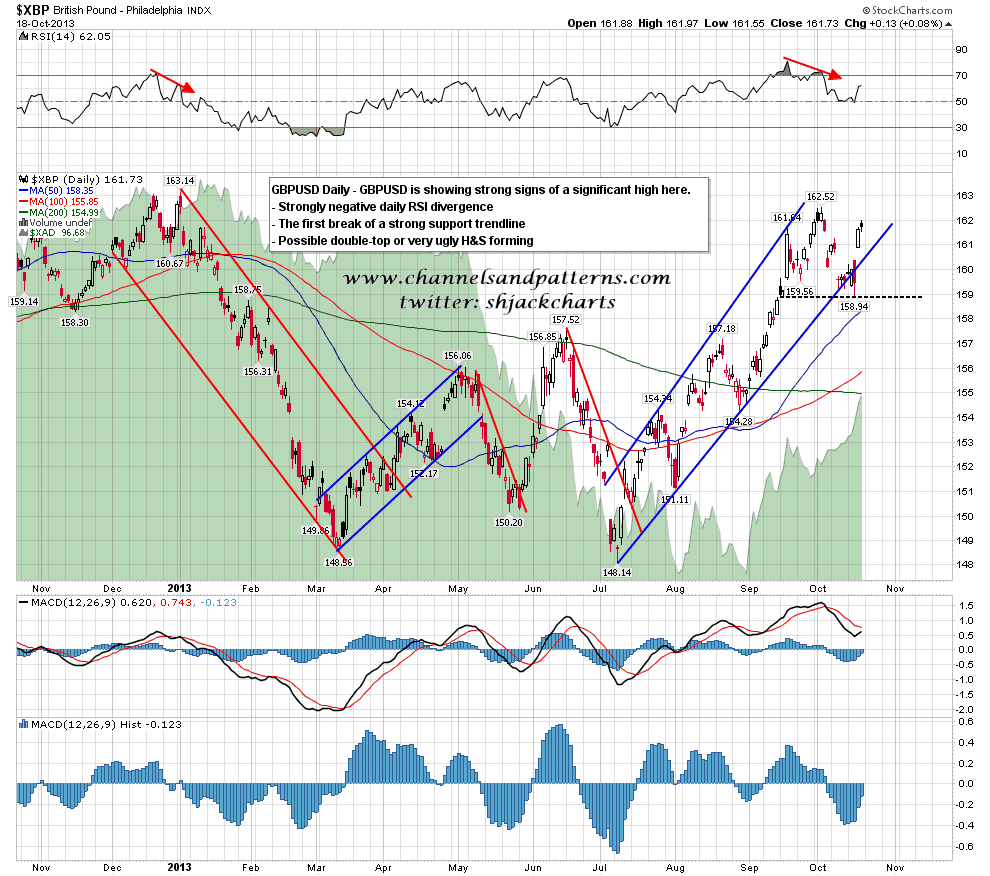
GBPUSD looks ready to roll over here on what might be a big reversal on my inverse proxy for USD. Clear daily negative RSI divergence, a first break below rising megaphone support, and forming who looks to be either a double-top or very ugly downsloping H&S. The uptrend on GBPUSD looks finished or finishing here. GBPUSD daily chart:
Now that SPX has hit the weekly upper bollinger band then history suggests strongly that the current uptrend must slow down sharply. The weekly upper BB can only rise at 10-15 points and closes above it (weekly close basis) are not only rare but when they do occur tend to signal multi-week tops. The weekly upper band is unlikely to close over 1760 this week and I’d expect a close nearer 1755. Upside is therefore limited until we see a retracement which we may well see very soon.
