
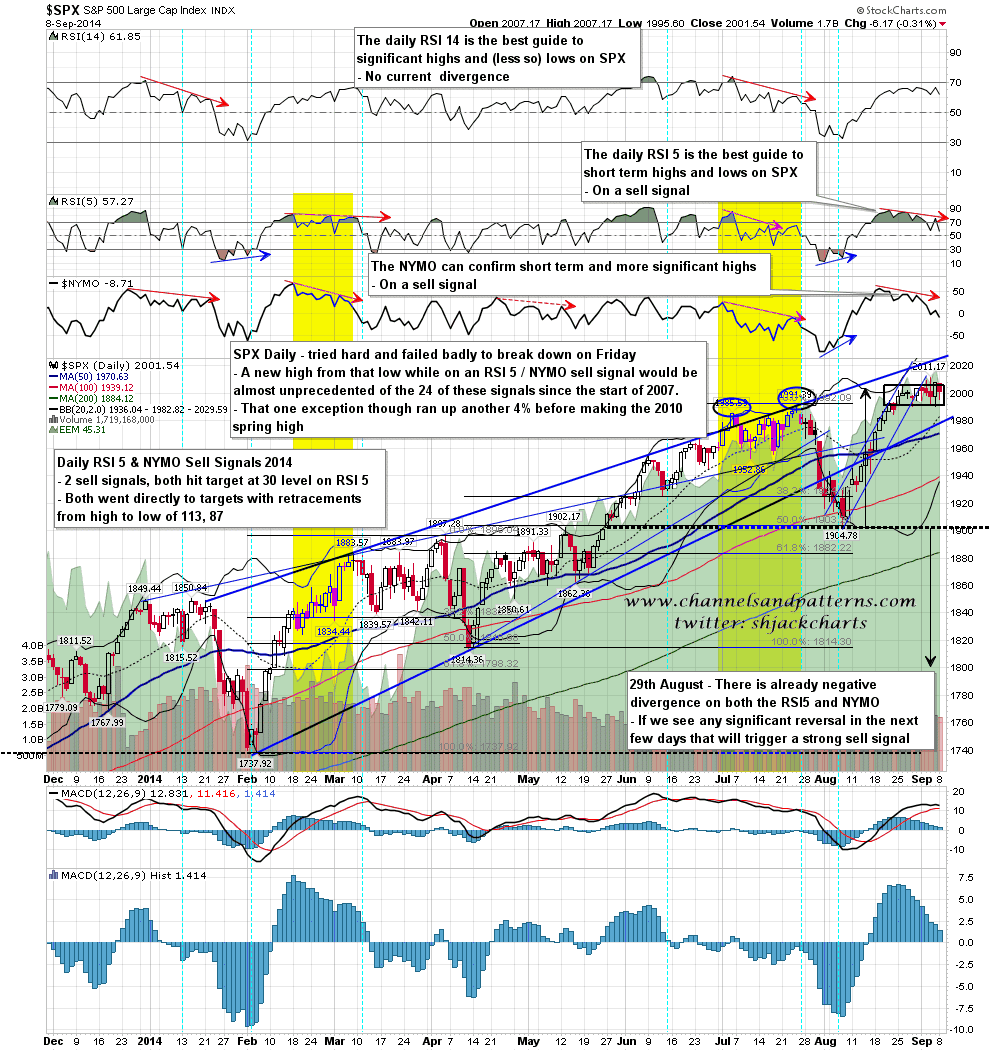
There’s not a lot to add to what I said yesterday about SPX, other than to say that we’ve seen nothing in the interim that tells us that SPX isn’t topping out here. A break over the 2011 high would impress. Failing that the next significant move should be down. SPX daily chart:
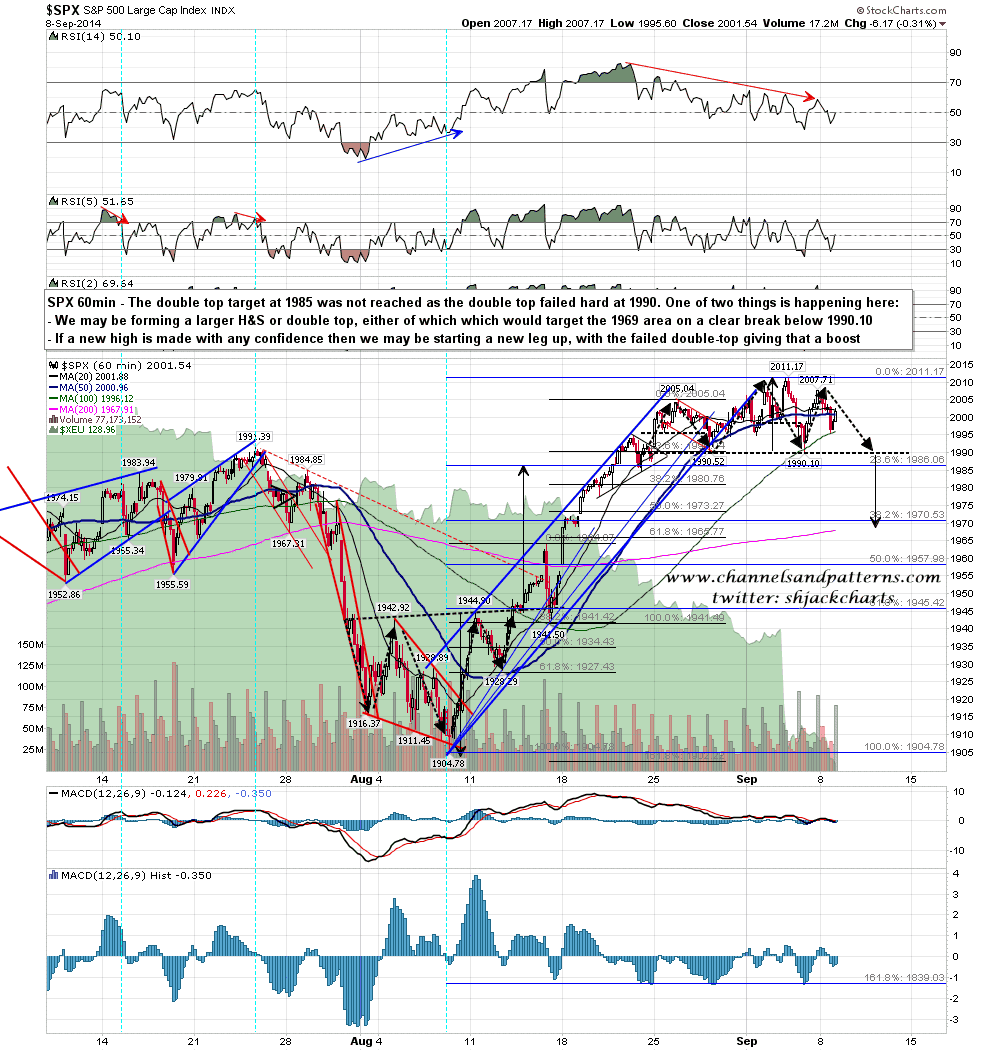
The pattern forming on SPX could be either an H&S on a double top. If it is an H&S then the right shoulder may need another day or so to form. SPX 60min chart:
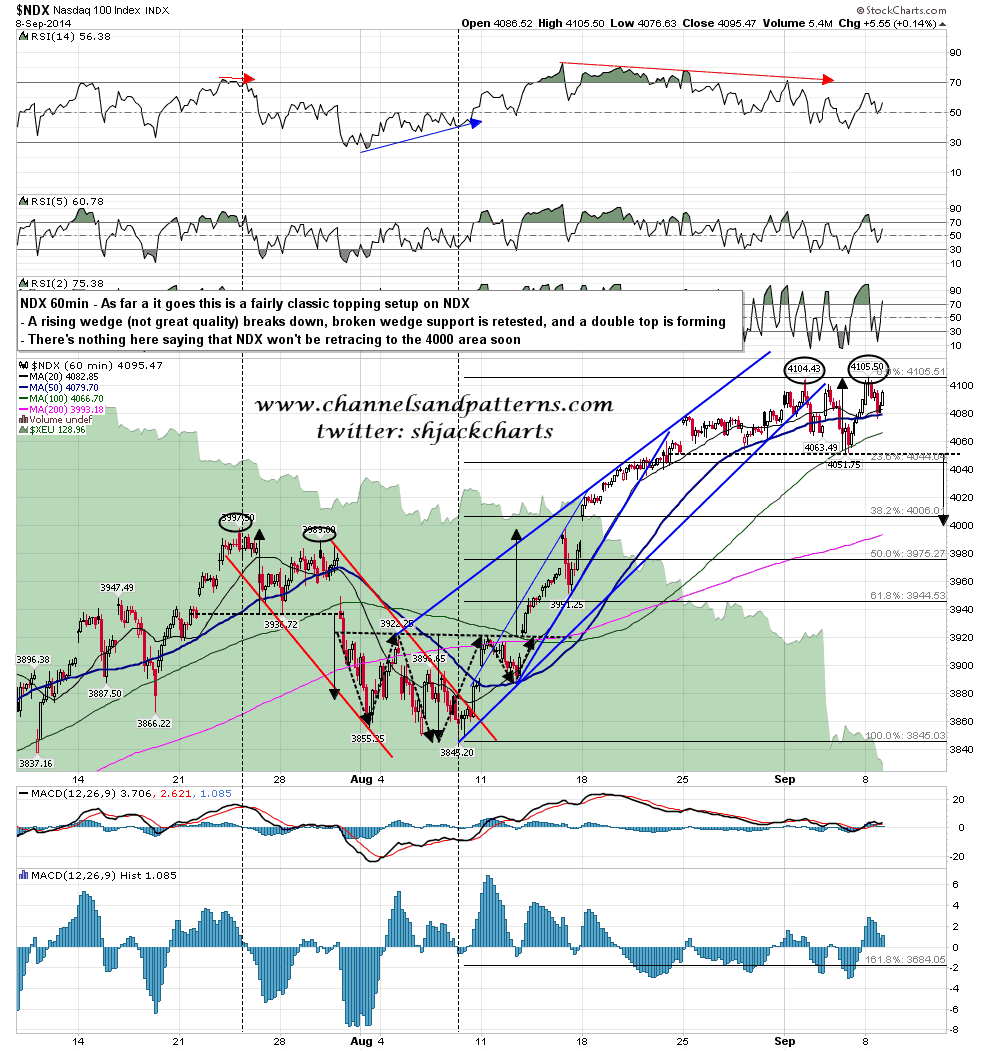
Someone mentioned to me yesterday that NDX wouldn’t allow the rest of the markets to fall. Possibly, though when I look at NDX here I see a classical topping setup. Obviously NDX would need to break below 4050 to trigger that double top target in the 4000 area. NDX 60min chart:
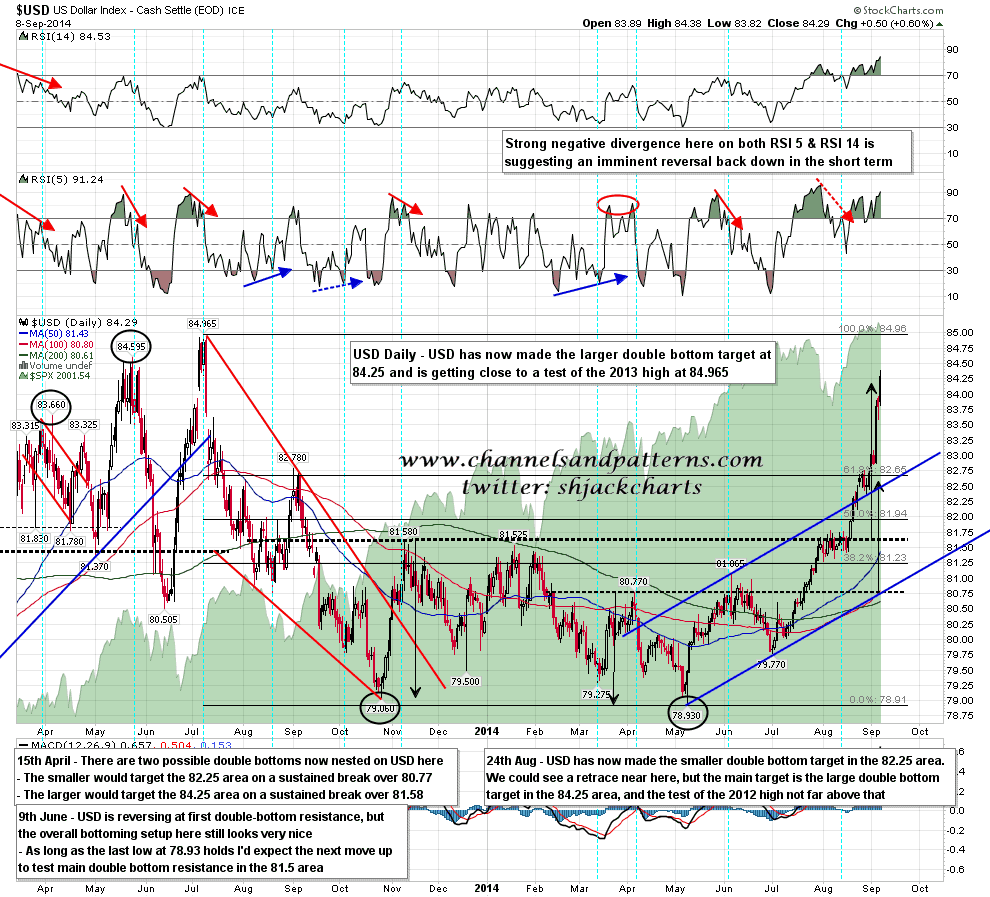
USD has finally made the larger double bottom target on this setup that I have been following since April. No obvious sign that a reversal is imminent here and I’m looking next for a test of the 2013 high at 84.965. USD daily chart:
As I was saying yesterday morning, SPX is now on a daily RSI 5 / NYMO sell signal and the stats for this signal argue very strongly that SPX needs to retrace (at least) before making new highs. There are always exceptions to any rule of course, but that remains my working assumption.
