From The Director: Tim and I are starting a new work on using options pre earnings to maximize the value of your options training. For these, we are utilizing Slopecharts to examine the relative price action prior to options activity. We are also backtesting our hypotheses into CMLViz, which is a great tool to help examine the promise of your options strategies. Please check it out here.
If enough interest we hope to offer a regular service and additional charts, depending again, on interest.
Slopecharts earnings price charts are only available through Diamond membership.
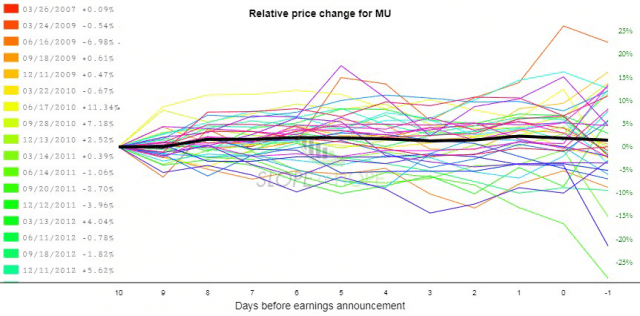
First, we take a look at MU (Micron), having earnings on Sept. 20th.
Here we see that 9 days before earnings, the price remains relatively flat until just before earnings (day 0). One way to take advantage of this is a calendar which is selling the front month option and buying the same strike price at a later expiry. If the volatility of said options increases or at least stays the same, the calendar improves or holds in volatility value, and over time the price increases due to more decay in the sold option than bought option. In pre-earnings volatility tends to increase until earnings d-day.
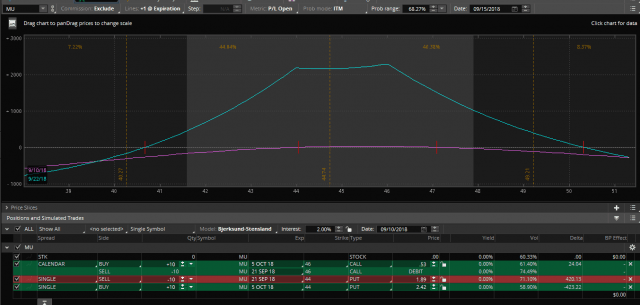
So one possible trade is to SELL the 45 delta put option (9 days expiry) and BUY the 45 delta put option (23 day expiry). I do the same with the calls as above (thus a “double calendar”)
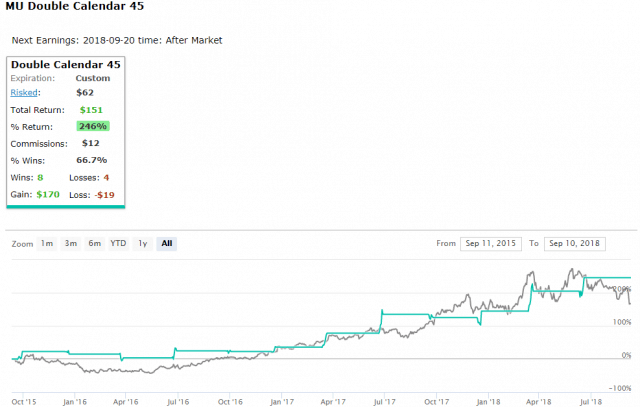
The result:
Over 3 years a 246% increase in value, over 12 trades, with 2/3 being winners.
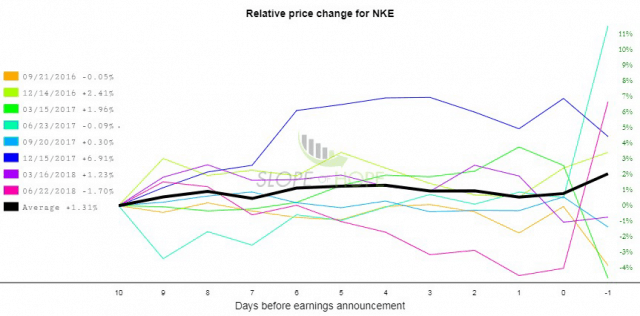
For Nike (now this is purely a financial article, so no discussion of the recent political decisions by Nike leadership), we see similar stability in price, starting at day 6.
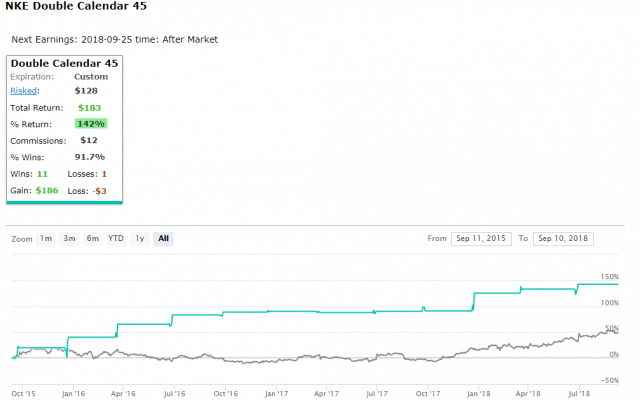
How does the calendar perform over 3 years?
Over 3 years 142% gain, over 12 trades with 91% win rate.
Please contact Tim or myself for questions about these ideas, or leave your thoughts and feedback in the comments section below. We need to know if there’s a latent interest in this kind of content and this style of trading. Thank you!


