Note from Tim: The Director and I are making baby steps toward giving the Slope of Hope a full-fledged options-oriented “site within a site”. I’ll be focusing my tools development in this area, and The Director is going to be ramping up his post contributors, including some exclusive Gold/Diamond-only posts later this week. We hope you enjoy this new direction, because I’ve been quite impressed at how many Diamond signups we’ve been getting lately (which is going to be “options central” on the site).
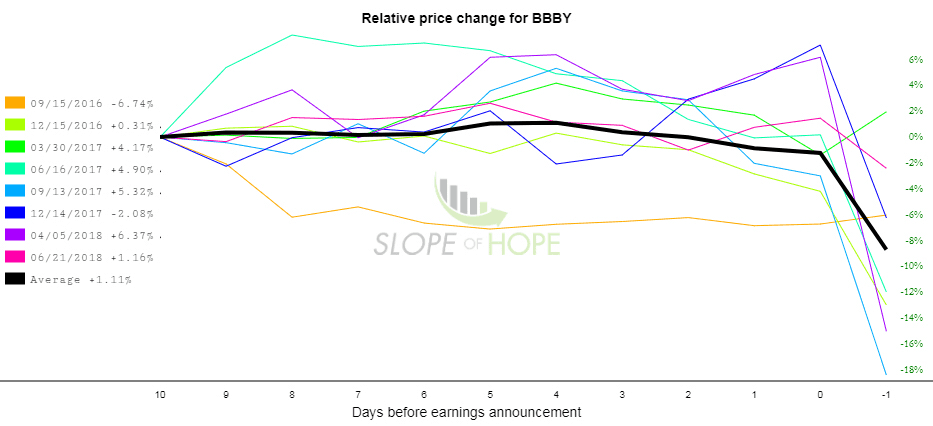
First up is BBBY (Bed Bath and Beyond, Earnings 9/26 after close). This has been a relatively dismal stock in last few years, as retail decay continues. We can see that earnings reports have likewise started to languish in the last few years (reminder: you can get Reaction Graphs here).
So, a bearish play may be of use. Here I use my “Super Bear” option spread. All 14 days to expiry, I put in a 35 delta long put with a 70-35 delta call credit spread (SELL the 70 delta, BUY the 35 delta).
Slopecharts show again, a downward bias to the prices as they approach earnings:
If we proceed with a Super Bear spread, starting 4 days before earnings and close 1 days after we get the following backtest results:

For our second trade we again return to a neutral disposition, to the 45 delta double calendar. This consists of shorting the 45 delta put AND the 45 delta call, with 9 day expiration and going long the 45 delta put and 45 delta call with 23 days to expiry.
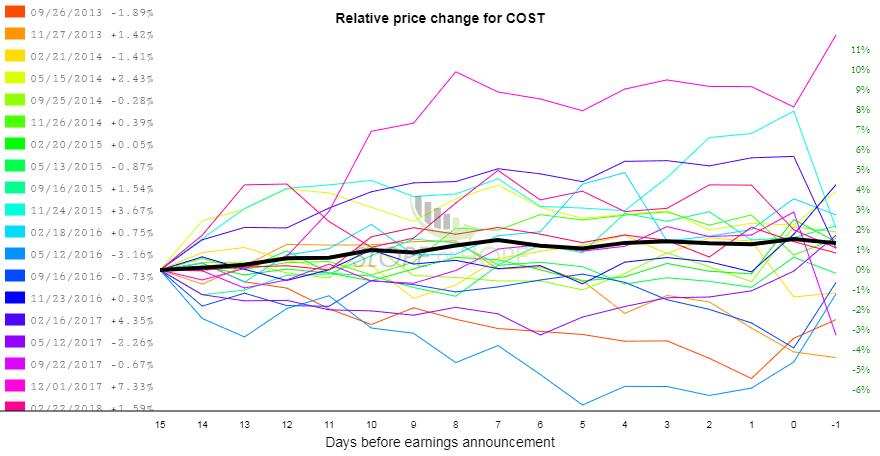
Let’s look at Costco (Earnings 10/4, post close).
Let’s look at the double calendar between 13 days prior to and 2 days prior to expiry from last 2 yrs:
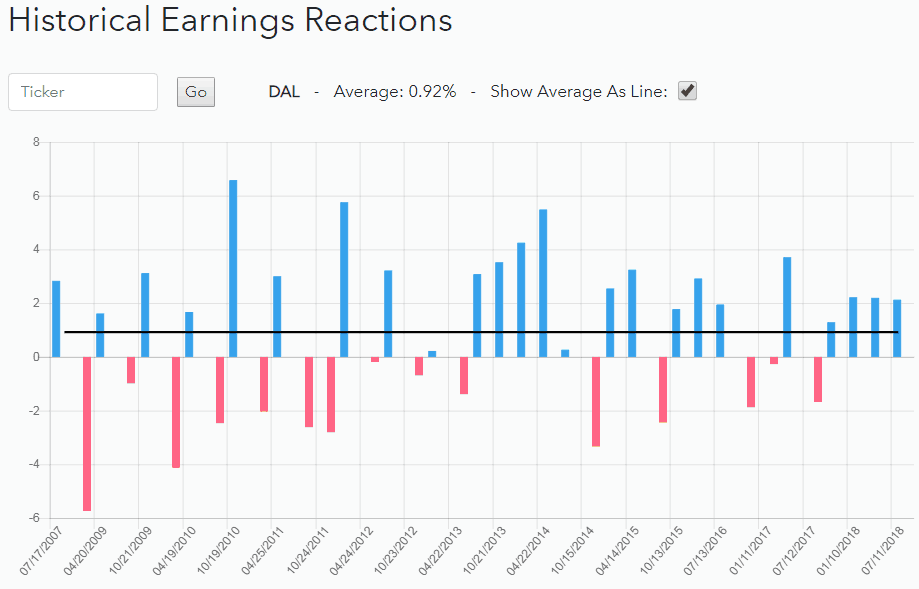
Next, let’s look at Delta Air Lines (DAL, Earnings date 10/11/18 before open)
Relatively flat between day 8 and earnings, with some increase near the actual earnings date. The amplitude of earnings reactions is muted.
What does a double calendar look like between day 8 and 0 (through earnings)?
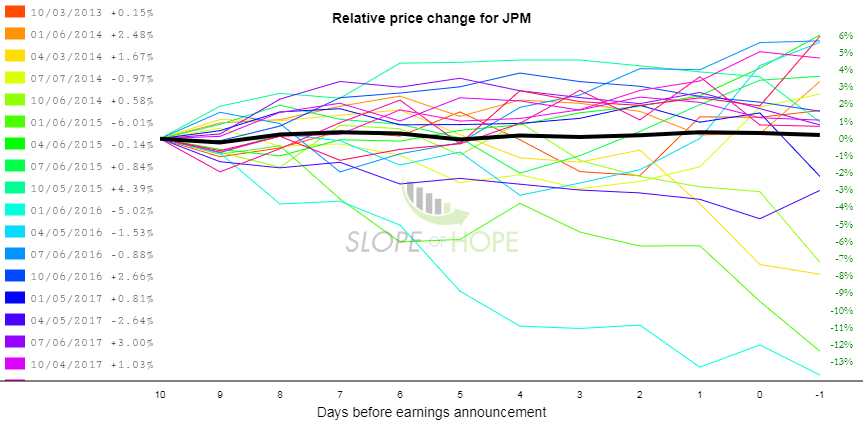
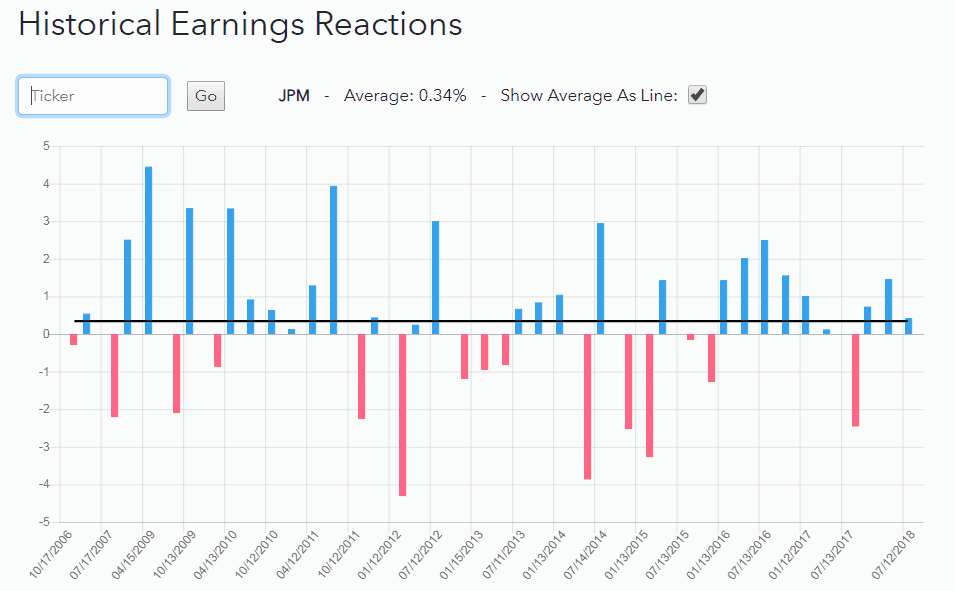
Now let’s look at JP Morgan, (earnings 10/12, before open)
Here we apply a double calendar between days 10 and the earnings date.
The amplitude of movement is small.
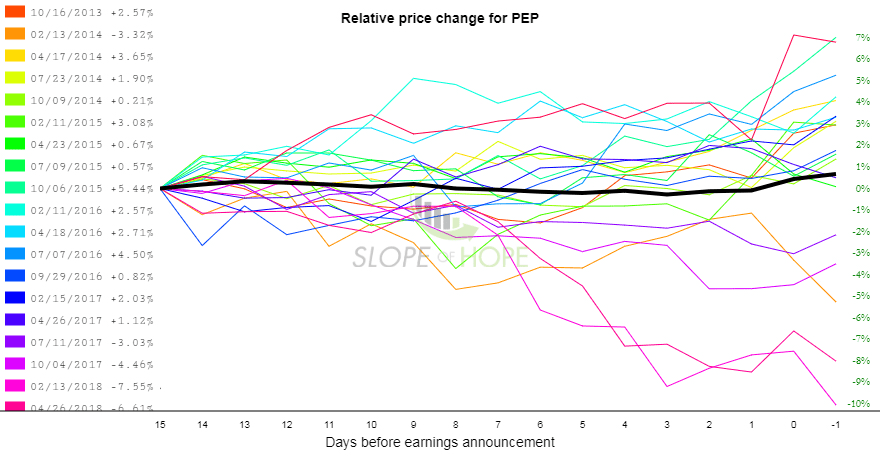
Now let’s look at Pepsi (earnings 10/2 before open)
Here we use the “Full Mullet” trade, short in the front, long in the back.
Meaning: a straddle buying the 50 delta call and 50 delta put 45 days out, and selling the 20 delta call and put 20 days out.
If we look at the Full Mullet starting 14 days before, and ending 2 days after:

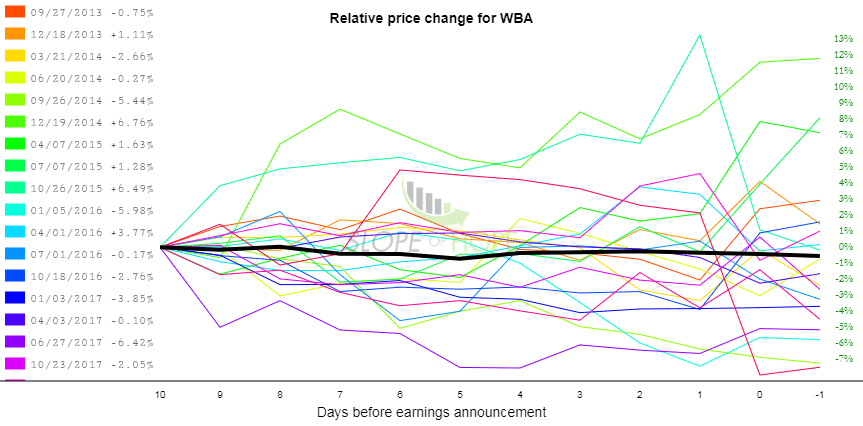
Last we’ll look at Walgreen’s (WBA, earnings on 10/11 before market open)
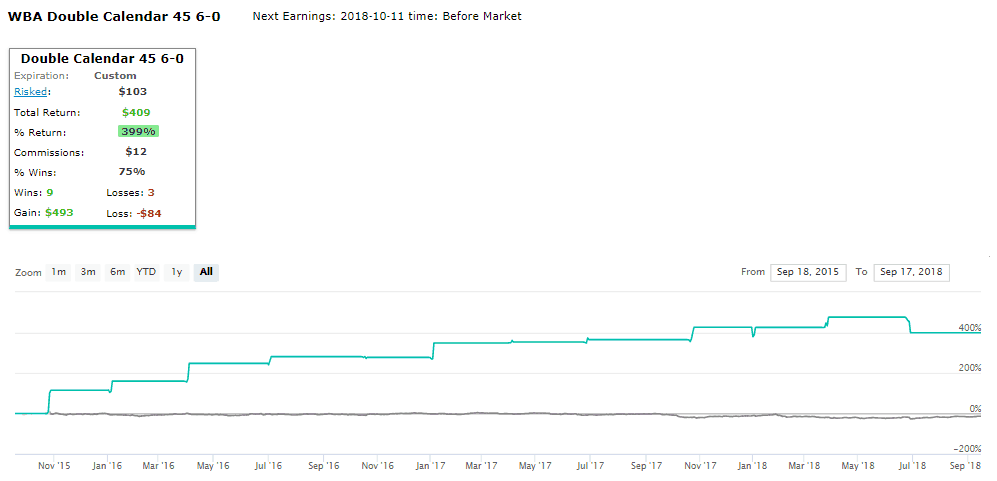
Let’s again turn to the double calendar. Again we will open the trade at day 6 before earnings, and take the trade through earnings.
A little riskier because the last earnings change was very negative. However overall, low amplitude which is borne out by backtesting.
Courtesy cmlviz.comAgain these are simply trade ideas, no guarantees here, but there is an exceptional edge with using SlopeCharts pre-earnings price charts and Earnings Reactions bar graphs.


