Note from Tim: I’m pleased to present another options trade ideas offering from Slope’s own The Director! Behind the scenes, we are beefing up the Diamond membership to encompass tools for options traders, and we’re whetting appetites out there with posts like these. Enjoy.
Outside of earnings ideas, here are some ideas based on edges in the field.
The Bollinger Band
The Bollinger band is a graphical standard deviation range away from the 21 day moving average developed by John Bollinger. The TTM squeeze is a proprietary indicator developed by John Carter that describes a state that where the Bollinger band is in a compressed, low volatility state.
When charts are in a lowered volatility state, they have an increased probability of a larger move in a specified direction. One can discern a higher probability of a certain direction using either the value and /or slope of simple momentum, or an increasing slope of the relative strength indicator (RSI), or the use of the Williams accumulation/distribution index’s slope diverging from the price.
Three instruments have recently shown lowered volatility and indication of lowered price direction.
XLE (IV RANK 18) has shown low recent volatility, with TTM squeeze present and momentum low.
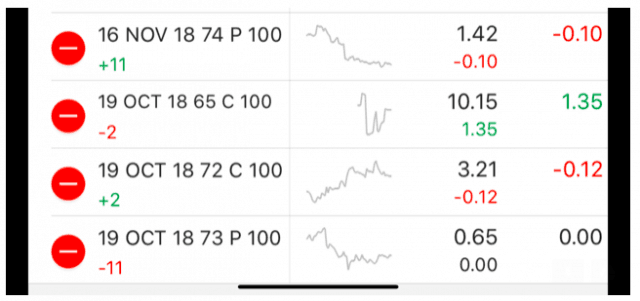
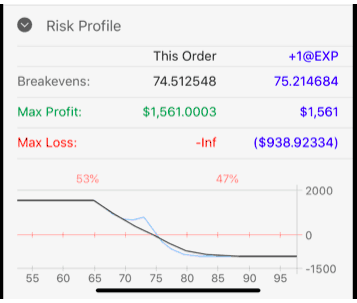
A bearish spread may be of use. We use a diagonal with a calendar to make money with time, direction and rising volatility.
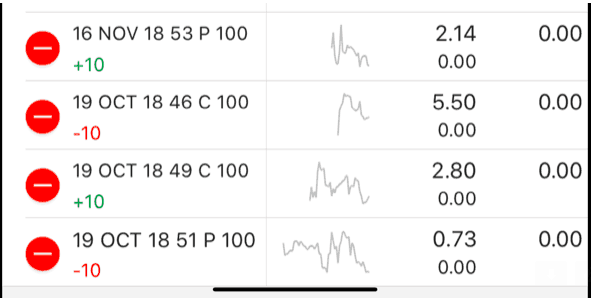
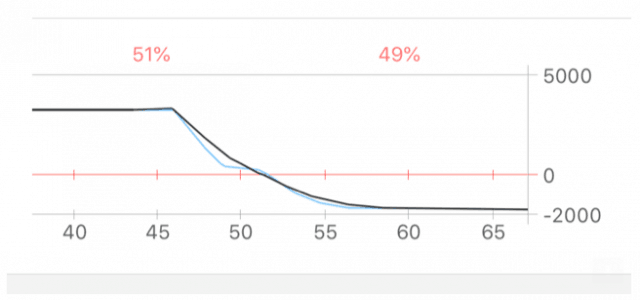
XRT (IV RANK 1) looking weak with low volatility, pos TTM squeeze and negative momentum. Again, a bearish spread with a diagonal and calendar may be helpful.
Again, we use a diagonal with a calendar to make money with time, direction and rising volatility.
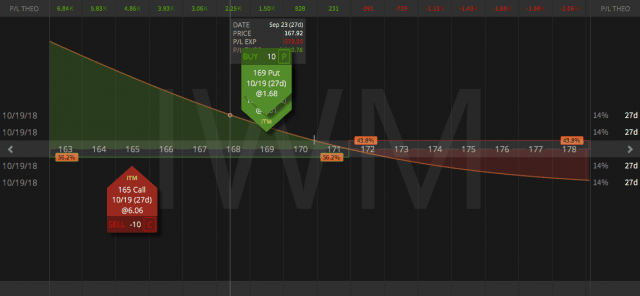
IWM (IV RANK 4) also with low volatility, TTM squeeze and low momentum. It is the weakest of the three indices.
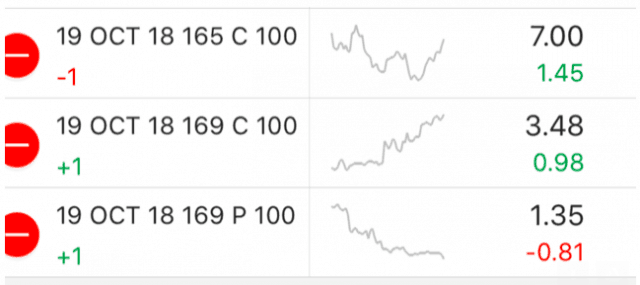
Here instead of a diagonal with a calendar we just have a super bear (long put, short credit spread), as below.
More earnings posts to come……..


