
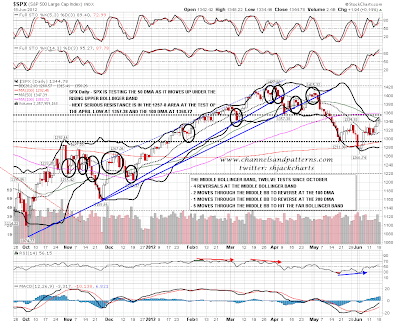
I was watching for a possible strong reversal yesterday but there was nothing to see, with the day following the standard bull format of early weakness followed by a rise for the rest of the day. On the daily chart SPX tested the 50 DMA, walking up the now rising upper bollinger band, and getting closer to the next serious resistance level above at 1357-8, with the April low at 1357.38 and the 100 DMA at 1358.72:
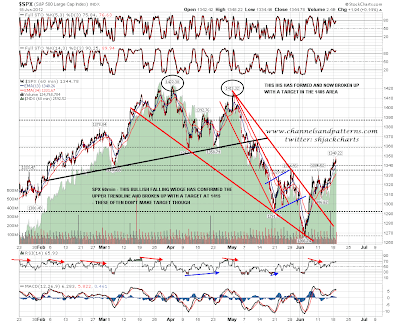
In terms of the IHS setups across various indices, those all strengthened yesterday. On the SPX 60min there was a test of the neckline and move up away from it:
The Dow also retested the neckline as support, though I'm still watching the possible rising wedge there. As a technical aside it's worth noting how a rising wedge of this kind can also be interpreted as an IHS with the neckline rising steeply. If the support trendline is confirmed with a third touch, and we then see a break up from this wedge, and these wedges break up 31% of the time of course, then the wedge target would be at new highs:

Of the two IHSes that I posted yesterday that had not yet broken up, NDX broke and closed over the neckline yesterday, triggering an IHS target in the 2710 area:

That leaves RUT as the laggard here, though it moved up slightly and the IHS is now close to completing. Looking at the action yesterday I would put this neckline at 776 at the moment

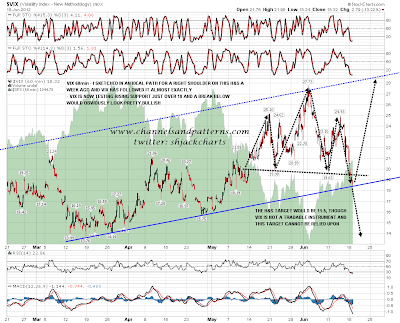
I sketched out an ideal right shoulder path on a possible H&S forming on Vix a week or so ago, and since then Vix has almost exactly followed that path to complete and break the neckline yesterday. It is now testing rising support from March, which is the key support level I gave then. A break below would look very bullish:
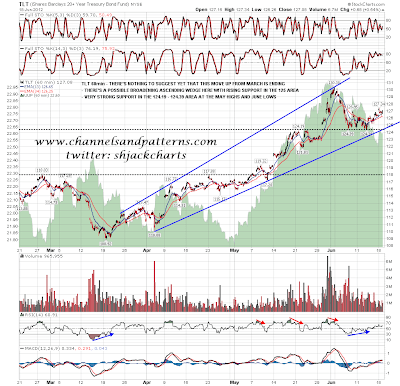
I do have concerns looking at other markets. There is a very well established inverse relationship between equities and bonds, and that's mainly because money moves from equities to bonds when fear is increasing, and from bonds to equities when it is decreasing. This relationship has weakened somewhat over the last year or so, with bonds still rising sharply when equities fall sharply, but not giving much back when equities recover. Overall this has been a sort of ratchet effect on bonds. That's the case here as well, and I'm not sure how much to read into that. In the short term though the uptrend on TLT is intact, and there is strong support in the 124-5 area. A break below would look bullish for equities, but as long as that support holds it only looks potentially bearish:
There is also a well established positive correlation between EURUSD and equities, but this has diverged for considerable periods in the past. The EURUSD chart still looks bearish here, with a large declining channel, and the current rally looking like a bearish pennant halfway from channel resistance to channel support. If it breaks down however that may do no more than slow down any rise on equities:

Overall the picture on equities looks increasingly bullish. The next targets for the bulls are the 1357-8 area on SPX, to break above the RUT IHS neckline at 776, and to break rising support on Vix just over 18. If those levels are broken then the short term pattern setup here will look very bullish indeed.
