
Some people like to give me flack when I try to offer up a measured move, but I’m not going to let a couple of dorks preclude me from offering up my ideas. In this case, we’re going to take a look at the biggest ETF of them all, the SPYders. Here’s the chart:
To explain the elements:
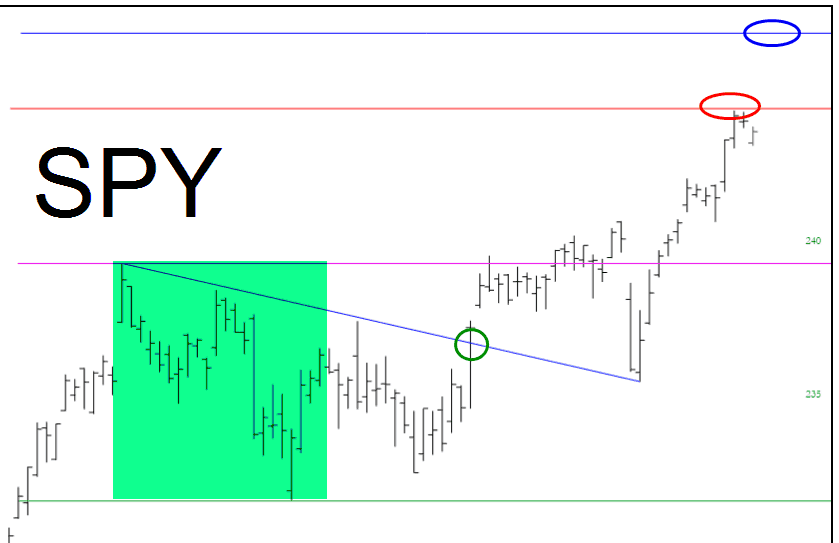
(1) The green tint is the height of the recent range
(2) The green circled area is the breakout from the pattern. If we use that as the basis for our measurement (as some books recommend), the target price is 244.41. That target (circled in red) was reached almost perfectly last Friday.
(3) However, if we take this same range value and add it to the top of the range, we get the higher level, shown with the blue line and circled in blue. This higher level, which is 246.95, corresponds almost perfectly to my “unusually bullish projection” of May 27th.
So that’s it! As always, time alone will tell.
