Slope of Hope Blog Posts

Slope initially began as a blog, so this is where most of the website’s content resides. Here we have tens of thousands of posts dating back over a decade. These are listed in reverse chronological order. Click on any category icon below to see posts tagged with that particular subject, or click on a word in the category cloud on the right side of the screen for more specific choices.

One Day Bear Market (by Springheel Jack)

By -

I posted the stats for the first trading days of every month in this bull market at the beginning of March, and I've done the same for the last trading days of every month on the same basis today. The contrast is stark. The SPX closed at 1328 yesterday, up 662 points since the intraday low of 666 in March 2009. Of those 662 points up, 184 were made on the first trading day of the month on a close to close basis, and if you'd sold at the open on a gap down, that would have increased to 234 points On that basis over 35% of all gains in this bull market could have been made on the first trading day of the month.

The last trading day of the month is statistically very weak in sharp contrast to the first trading day, and going long on a close to close basis would have lost you an accumulated 69 points since March 2009, which is to say that the last day of the month has been a brutal one day per month bear market within the overall bull market. That could have been improved somewhat by just going long at the open on a gap up from the previous close, but even in that case, you'd be up only three points over the period. Here's the table showing the stats:


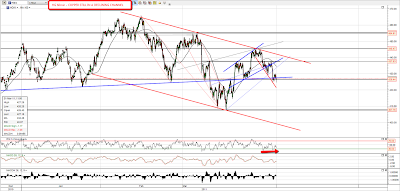
In summary, the historical odds for an up day today are poor, and the odds for a long taken out at the close tonight, and held through tomorrow unless there is a gap down from the previous close, are extremely good. On that basis the important support levels on ES and NQ are covered in yesterday's post, and I'll just mention that I'm seeing rising channel resistance on ES in the 1337-39 area in case ES beats the odds today and rises anyway.

As that's cleared some space today, I'd like to have a good look at copper, which I'm concerned about because it is divergently bearish compared to equities. I posted the current range levels yesterday, thinking as I did so that the obvious next move was to support at 426.5, and it moved there shortly after I posted the chart. It's been trading around there since then and is showing some encouraging signs of making a low, though I'm concerned that it is still in an overall declining channel, and the strongest short term trendline is the declining support trendline from 440. That support trendline now has five hits and looks a very good counter-trend long entry if it hits again, within the larger downtrend:

On the weekly chart the outlook also looks somewhat bearish, with a very strong resistance trendline that has now been hit six times in the last five years, though it has a history of multiple hits in short succession and we've only hit it once so far this time. I've added two internal trendlines to show that copper may have made a decent short term low, but if it gets back to 400 the obvious target is in the 360 area:

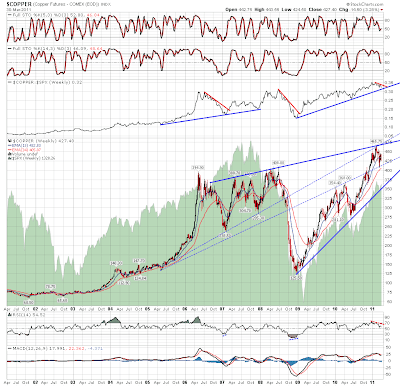
I've charted the second chart against SPX as there's a question in my mind as to whether equities might follow if copper breaks downwards. The evidence is ambiguous as though copper and SPX have tracked very well in the current bull market, the correlation was much weaker in the last one. Something to watch however.

The other instrument that I'd like to have a close look at is EURUSD, where a very important moment of truth is approaching. I mentioned this a few times but I'd like to underline quite how important this area is as it is the upper trendline of a huge falling wedge that would indicate to the 1.10 area if EURUSD fails to break up through it. The test will come in the 1.428 – 1.43 area, and the current rising wedge is not immediately encouraging for EURUSD. If EURUSD does top here, that doesn't have any immediate implications for equities as the last peak was in November 2009, some five months before equities topped in April 2010:

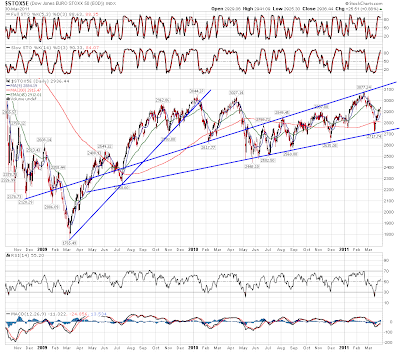
I don't know if anyone reading this trades the european stocks much, but I've seen something worth seeing if you do, and it is a simply beautiful broadening wedge on the Euro Stoxx 50. Nice clear upside target for this current wave up there:

I won't post the charts for main US indices today but the Russell 2000 made a new high yesterday, and we're close to new highs on most indices. The overall uptrend looks strong and I'm leaning strongly bullish on equities here. There are some concerns about the uptrend, but that's why they describe bull markets as climbing a wall of worry.  If ES obeys the statistics then we could see a test of 1315 today and that would be a very nice long entry in my view. Any move below 1310 would break the current rising channel lower trendline, and a break with confidence of 1300 would be a strong signal to exit longs until the situation clarified.

Natural Gas Chart Analysis (by Mike Paulenoff)

By -

Apart from whether or not President Obama actually lays out a natural gas program in today's speech, my technical work on iPath DJ-UBS Natural Gas TR Sub-Idx ETN (GAZ) is "warning" me to expect higher prices regardless.

Let's notice that the March upleg from 6.85 to 9.05 has returned to its 50% support plateau (this morning), where it pivoted to the upside into a potent rally to 8.35 so far. Right now, my near-term work in natural gas futures, the U.S. Natural Gas ETF (UNG), and GAZ indicates that a new upleg likely started at this morning's lows.

A climb that sustains above 8.40 will be the first confirmation that a new upleg is in progress.

QkPwarW7I
Originally published on MPTrader.com.

SPY Update (by Leaf_West)

By -

LA_06 As most readers of my blog have seen with my posts in the blog and in the live chat, I have been looking for a push into the $132-$133 area as the first leg of the "B" Pattern in an ABC Zigzag correction off of the Feb 2011 highs.

For those of you unfamiliar with eSignal, the rainbow colored bar is the "MOB" target drawn by their charting software.  MOB stands for Make-or-Break, and it is drawn off of pivot points using Elliott Wave Theory.

March 24th Forecast:

SPY_March24, 2011_Pre-Market01

Current Chart:

SPY_March30, 2011_TradingDay01

The first leg down from the Feb top ("A" of the ABC Zigzag) was in itself a zigzag and therefore I am expecting a flat pattern for the B leg pattern.  For those readers that are less familiar with this, here is what I am expecting (along with the forecast I drew on March 24th) …

SPY_March30, 2011_TradingDay02_ABC

March 24th Chart:

SPY_March24, 2011_TradingDay04

Cheers … Leaf_West      Visit my Blog

Lessons in Sentiment (by George Rahal)

By -

There was a powerful uptrend in the stock market from September 2010 to February 2011, interrupted by one correction in November. I have anecdotally observed that 1344 exceeded the price target that many were expecting before another correction would ensue.

Throughout much of this trend, as early as December when the S&P 500 was in the low 1200s, high levels of bullishness, measured by investor polls and option put/call ratios, were often quoted as a reason to expect a 5% or greater correction. I was also guilty of these forecasts, embarrassingly early. 

What have I learned? For anticipating market turning points, extreme bullish or bearishness is only part of the sentiment picture. This sentiment sets the conditions for what I am hypothesizing is a better sentiment-based timing tool—that is, capitulation. Synonymous with surrender, this is the preferred term in finance for two similar behaviors. First, capitulation is when investors who have held on to positions during a bear market with the tenet that “prices always go back up,” finally cannot endure the pain of seeing the value of their accounts drop, and decide to sell. This is an event that defines a primary trend. Smaller trends and turning points can be affected by the second type of  capitulation, in which the callers of a bottom in a bear market give up and turn bearish, or the callers of a top in a bull market give up and turn bullish.

It is not extreme sentiment that will cause the market to turn, but rather, capitulation. One would expect capitulation to occur in an environment of extreme sentiment. As long as there is a significant enough group of individuals calling for a top, there may be 1) short sellers and 2) buyers on the sideline, not wanting to enter at a top. A top occurs once there are no buyers left—investors on the sidelines can still buy and shorts must buy to cover positions. These two groups must be converted before the actual top is printed.

A great and sad irony results from these phenomena. If capitulation is a necessary condition for a top or a bottom, then the market will not turn until it occurs. Think about that. As long as a group of individuals hold on to their belief that the markets will turn, the markets won’t turn. The majority’s conviction must be broken because this conversion, ipso facto, caps off the trend.

Sometimes, capitulation is identifiable by major spikes in volume coupled with parabolic moves in what are called blow-off tops and panic bottoms. There are no polls set to capture this type of surrender, per se. What one must identify is the conversion of bulls to bear or of bears to bulls, not the absolute level of each. To do so, one must scout for viable anecdotal evidence. Perhaps technical tools can be devised to measure this conversion.

In summary, in an environment of extreme sentiment, one must look and wait for capitulation in order to better time a turning point. For this to happen, I hypothesize that the majority of countertrend forecasters or traders, by necessity, have to convert. Until they do so, an established trend will continue.

(To read other market-themed essays, please visit my site .)