Slope of Hope Blog Posts
Slope initially began as a blog, so this is where most of the website’s content resides. Here we have tens of thousands of posts dating back over a decade. These are listed in reverse chronological order. Click on any category icon below to see posts tagged with that particular subject, or click on a word in the category cloud on the right side of the screen for more specific choices.
GSIC Looking Sick
Once Again – EFA – the Asian ETF
I mentioned EFA as a good short a couple of trading days ago. That was a little soon, considering yesterday's big surge across the board in equities, but I'd like to offer this chart again, since the retracement seems to be a superb shorting opportunity.
TBT=TNT
I entered a short position on TBT this morning. For one thing, I think interest rates are going to head lower, which will depress this security, and second, these "ultra" ETFs are inclined to degrade anyway. My stop is at 37.33
Wedges turned Channels (by Springheel Jack)
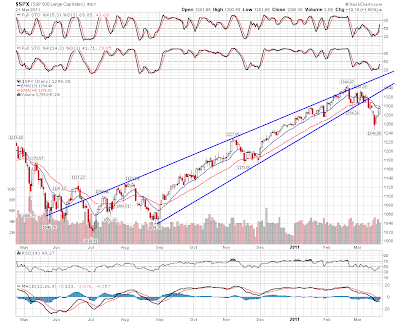
I puzzled over the rising wedge on SPX at the recent high, as it overthrew, and that raised a number of questions about direction. Normally when a rising wedge breaks down, as they do about 70% of the time, the first target I look at is the trendline parallel to the upper trendline, as rising wedges turn into rising channels a lot, but an overthrow eliminates the obvious channel target, as the upper trendline has then been broken. An overthrow can therefore indicate that the rising wedge is going to play out to the classical pattern target, 1040 SPX in this case, but I thought that was unlikely as the timing is wrong. I've never thought that we were looking at a top like the April top here, I was looking for a pre-high retracement like January last year if the rising wedge support trendline was broken. Here's the rising wedge on the SPX daily chart:
Unexpected price moves aren't always significant of course, but they can signal that a significant change is taking place, and they are placing a marker for a new trendline for a channel or pattern. Looking at SPX now, it appears that the overthrow was setting up a slightly steeper upper trendline for a rising channel, and that the recent low has confirmed the lower trendline of that channel. Here's how it now looks on the SPX daily chart:
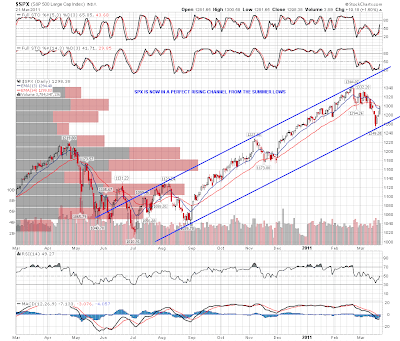
This isn't welcome news, as I've been looking for a decent classical low for this move with positive divergence on the SPX daily chart, and with this atypical rising wedge turned channel now established, I think that is now much less likely, though I haven't eliminated it as a possibility.
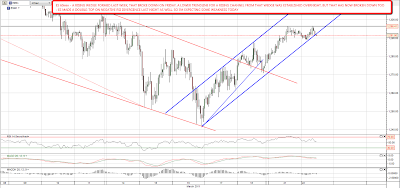
Short term ES and NQ look weak. ES formed a rising wedge last week which broke down on Friday. The lower trendline for a rising channel from that wedge was established overnight and that has broken down too. ES also made a nice looking double top overnight on negative RSI divergence, so until ES can get over the high for yesterday and overnight the setup looks bearish. NQ is also underperforming ES which likewise looks bearish. Here's the ES 60min chart:
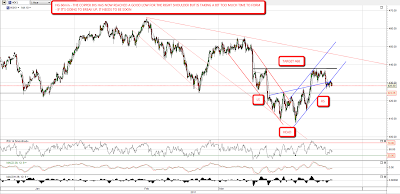
I was doubtful about much upside from the open yesterday in part because copper was retracing. It has now formed a solid low for right shoulder of the forming IHS, and should rise soon if the IHS is going to play out. I'm watching to see whether copper can get much above 430 and the IHS neckline is just under 438:
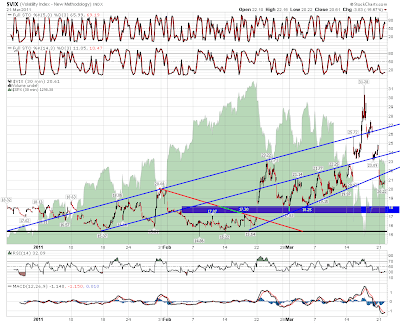
Vix has broken back down through the support trendline for the first part of the correction, which is a signal that the correction may well have bottomed:
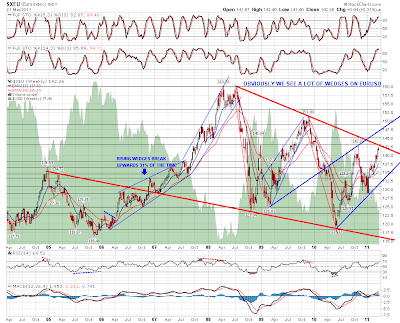
EURUSD is now very close to the declining resistance trendline from the 2008 high, and on close inspection that is at just under 1.43. It could well reverse there though I'm expecting it to break up on the balance of probability:
I'm leaning increasingly towards the view that the correction has bottomed, but short-term, unless ES can break the overnight highs, I'm leaning short. If ES does break the overnight highs I'm seeing strong resistance at 1303.5:
I've started posting links to intraday charts and some charts that don't make the cut for my daily posts on twitter, as I was already using it to follow some traders and chartists, and my twitter handle is shjack666 for anyone who'd like to follow those.
